Fig. 10.
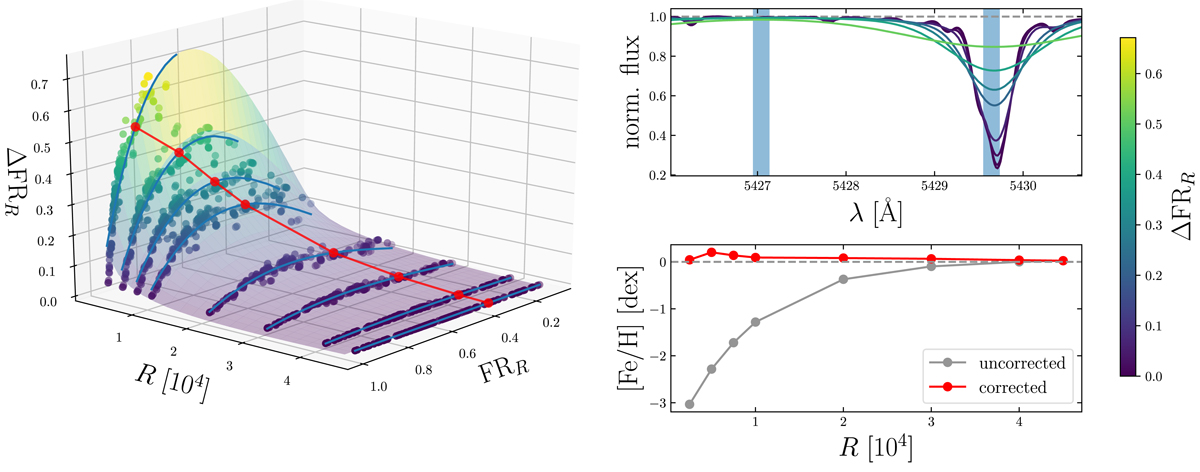
Left panel: deviations of the FRs measured in all training spectra for the strongest metallicity relation (see Table A.2) at different resolutions with respect to the FRs computed at the original resolution of 45 000. In contrast to Fig. 9, we note that there is a non-linear relation between FR and [Fe/H], which is why we illustrate only the FR- and not the [Fe/H] deviations. The colored surface resembles the best-fit model to the data according to Eq. (14), where the color indicates the magnitude of the correction to be applied (see color bar on the right). Red points and their connecting line denote the track of the corrections to the FRs measured in the solar spectrum at different resolutions. Upper right panel: portion of the solar spectrum at resolutions of 45 000, 40 000, 30 000, 20 000, 10 000, 7500, 5000, and 2500 (dark- to light-colored). The color-coding refers to the same FR corrections as in the left panel. Blue vertical bars indicate the wavelength ranges from which the FR is computed. Lower right panel: derived [Fe/H] for the Sun from uncorrected (gray) and corrected (red) FRs using Eq. (10) and only the strongest metallicity relation shown in the upper right panel.
Current usage metrics show cumulative count of Article Views (full-text article views including HTML views, PDF and ePub downloads, according to the available data) and Abstracts Views on Vision4Press platform.
Data correspond to usage on the plateform after 2015. The current usage metrics is available 48-96 hours after online publication and is updated daily on week days.
Initial download of the metrics may take a while.