Free Access
Fig. 3
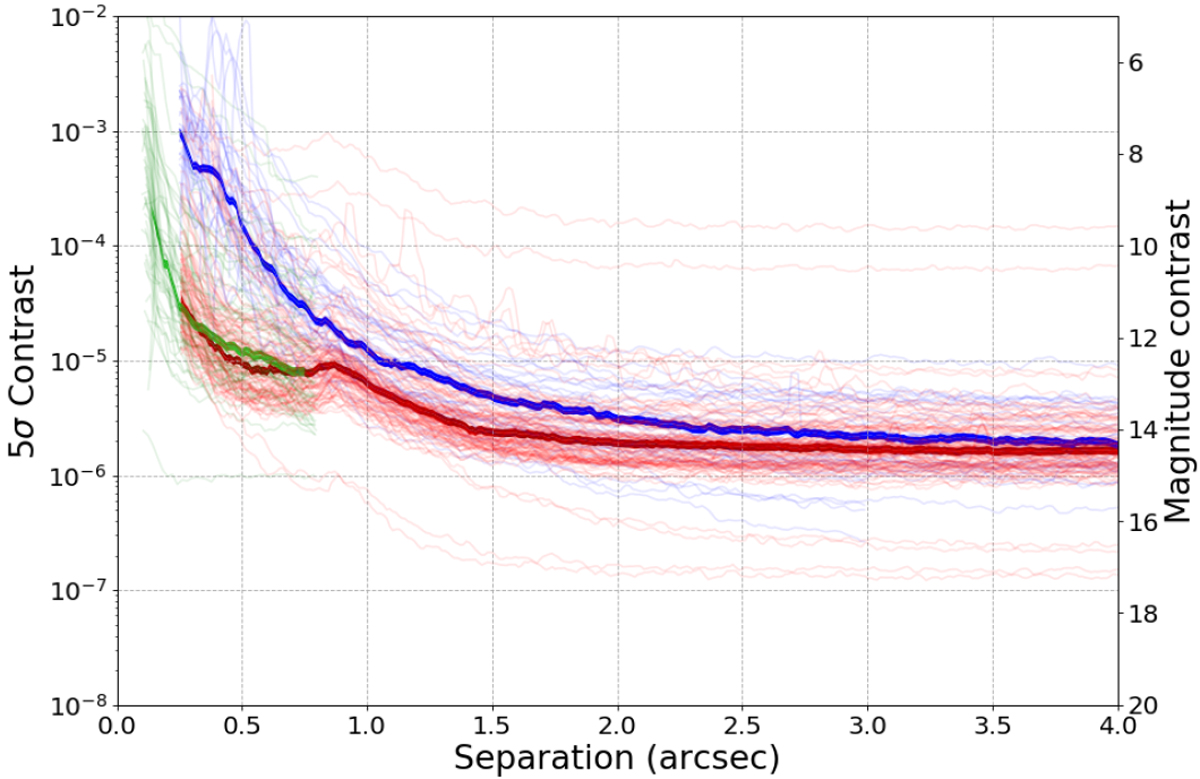
Contrast curves for the targets in the SPOTS survey. Blue, red, and green light curves are the individual contrast curves for the binaries observed by NaCo (LOCI), SPHERE/IRDIS (best of LOCI and PCA 10 modes), and SPHERE/IFS (best of TLOCI and PCA 5 modes), respectively. The thick curves correspond to their median values.
Current usage metrics show cumulative count of Article Views (full-text article views including HTML views, PDF and ePub downloads, according to the available data) and Abstracts Views on Vision4Press platform.
Data correspond to usage on the plateform after 2015. The current usage metrics is available 48-96 hours after online publication and is updated daily on week days.
Initial download of the metrics may take a while.