Fig. 4.
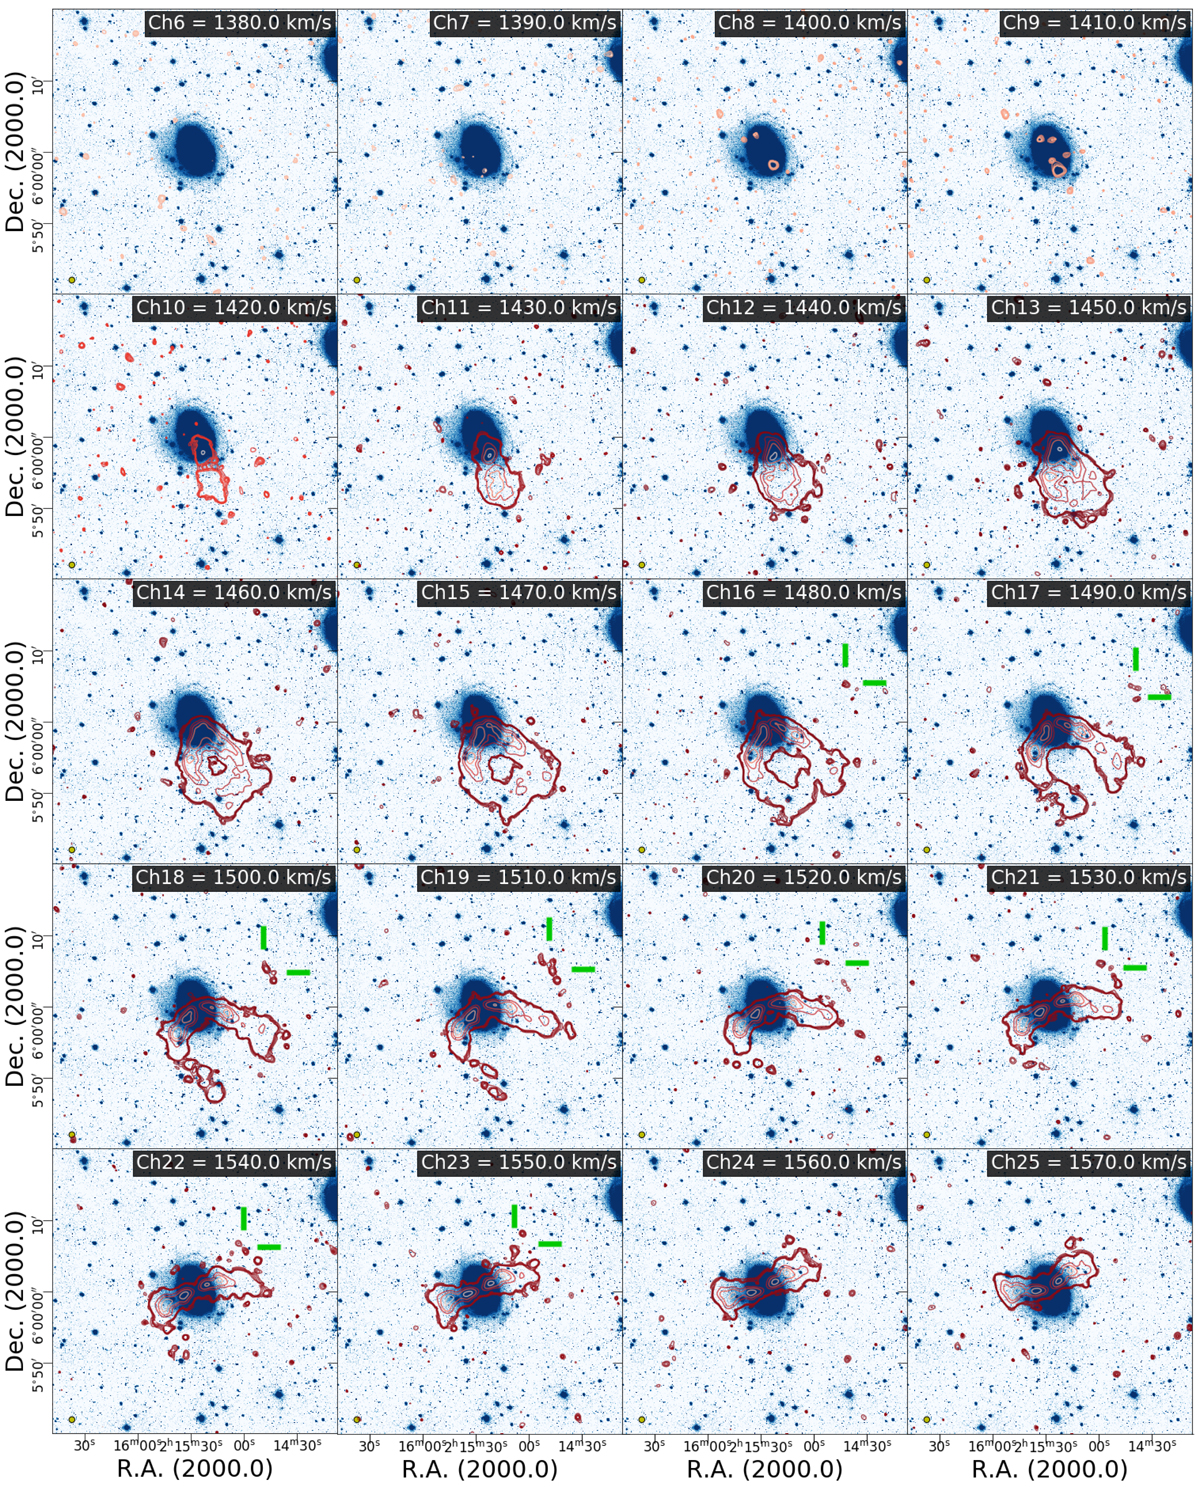
Channel maps of the wavelet filtered HI cube superimposed on the VST optical image of CIG 96. The field of view is approximately 25′ × 25′ (147 × 147 kpc). Foreground: red contours correspond to 3.4, 3.9, 4.5, 5.1, 5.6, 28.1, 56.2, 112.5 and 224.9σ levels (rms = 0.126 mJy beam−1, 1σ) or the equivalent HI column densities of 0.6, 0.7, 0.8, 0.9, 1.0, 5.0, 10.0, 20.0, 40.0 × 1019 cm−2, respectively. Green and magenta marks indicate the NW and SE HI features, respectively. The synthesized beam of 28″ × 28″ is shown in the bottom left corner as a yellow circle. Background: VST image of CIG 96. We display a SB range of μr SDSS = 26.0–28.4 mag arcsec−2 to enhance the outskirts of the galaxy while brighter inner structures are not shown.
Current usage metrics show cumulative count of Article Views (full-text article views including HTML views, PDF and ePub downloads, according to the available data) and Abstracts Views on Vision4Press platform.
Data correspond to usage on the plateform after 2015. The current usage metrics is available 48-96 hours after online publication and is updated daily on week days.
Initial download of the metrics may take a while.