Free Access
Fig. 17.
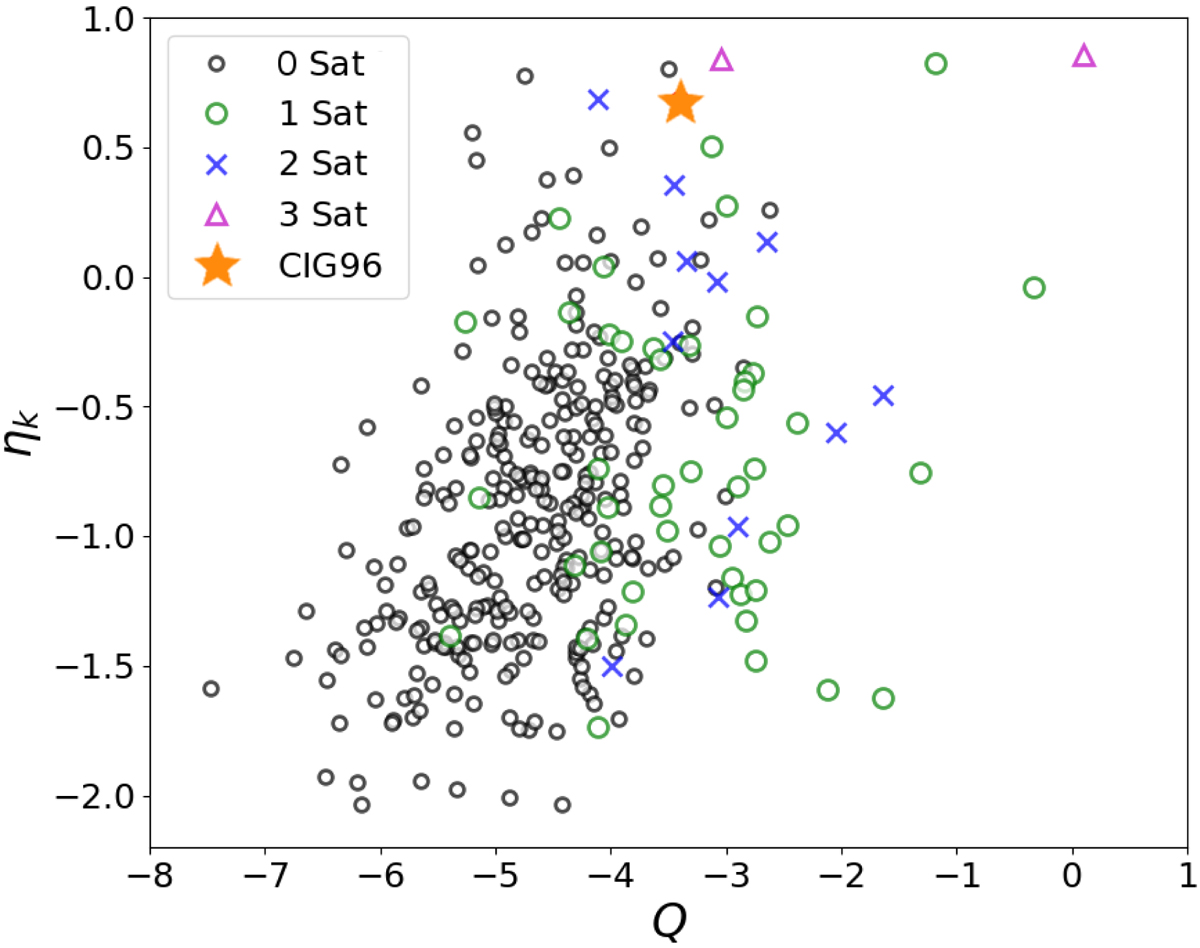
Representation in the isolation parameters of the subsample generated with spectroscopic data of CIG galaxies as calculated by Argudo-Fernández et al. (2014; q.v. Fig. 8 of that work). Lower values of local number density ηk and tidal force estimation Q represent higher isolation. The position of CIG 96 is highlighted.
Current usage metrics show cumulative count of Article Views (full-text article views including HTML views, PDF and ePub downloads, according to the available data) and Abstracts Views on Vision4Press platform.
Data correspond to usage on the plateform after 2015. The current usage metrics is available 48-96 hours after online publication and is updated daily on week days.
Initial download of the metrics may take a while.