Fig. 2.
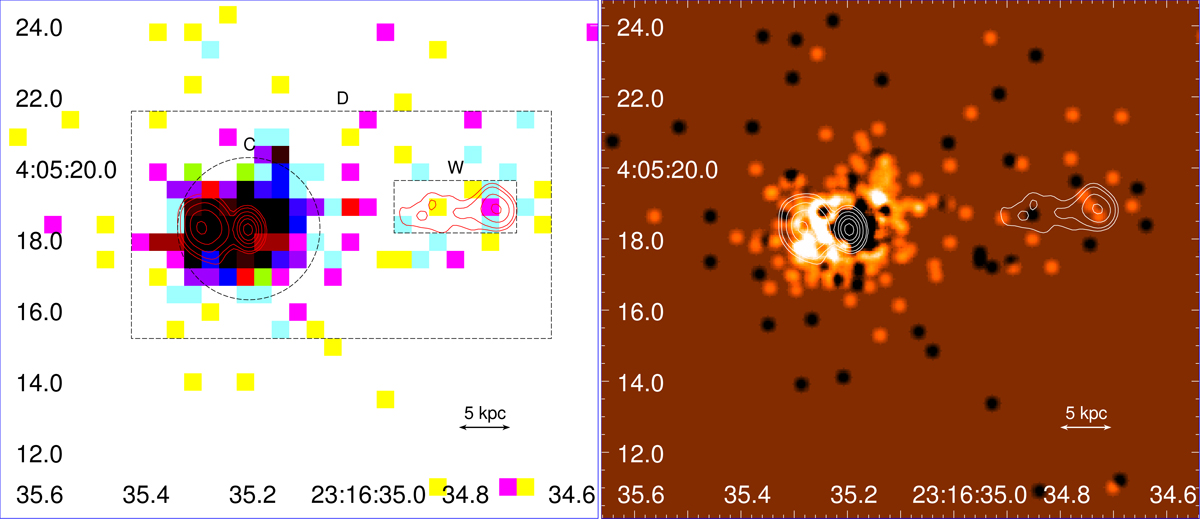
Left panel: composite RGB image of the X-ray count map of 3C 459. The native pixel size, corresponding to 0.492 arcsec, is shown. Different colors distinguish three energy bands: cyan (0.5–1.0 keV), magenta (1.0–2.0 keV), and yellow (2.0–7.0 keV). The contours of adopted extraction regions as described in Sect. 4.1 are marked with black dashed lines. Right panel: map of the hardness ratio obtained adopting 0.5–2.0 keV and 2.0–7.0 keV as the soft (white points) and the hard (black points) X-ray bands, respectively. A smoothing with a Gaussian (σ = 0.123″) has been applied.
Current usage metrics show cumulative count of Article Views (full-text article views including HTML views, PDF and ePub downloads, according to the available data) and Abstracts Views on Vision4Press platform.
Data correspond to usage on the plateform after 2015. The current usage metrics is available 48-96 hours after online publication and is updated daily on week days.
Initial download of the metrics may take a while.