Fig. 4.
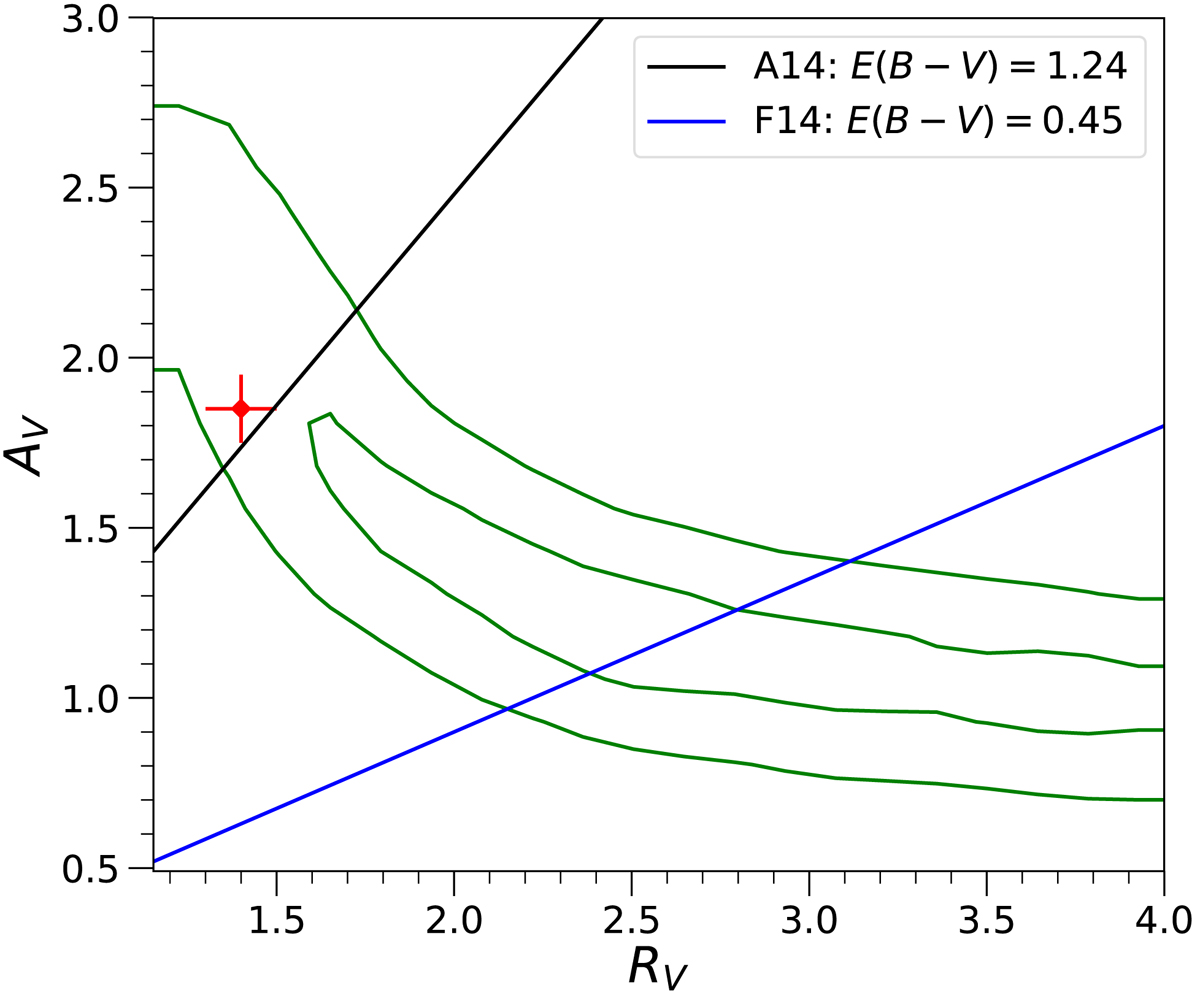
Distribution for RV and AV values by fitting the [Fe II] lines (the contours shown here are for the April spectrum, the results for the May spectrum are consistent with the contours displayed here). The values measured by Amanullah et al. (2014) are marked in red and agree with our April spectrum. The contours mark the 1 and 2σ credible regions of the MCMC samples. The lines show a constant E(B – V) of 1.37 as derived by Amanullah et al. (2014) and a constant E(B – V) of 0.45 as derived by Foley et al. (2014).
Current usage metrics show cumulative count of Article Views (full-text article views including HTML views, PDF and ePub downloads, according to the available data) and Abstracts Views on Vision4Press platform.
Data correspond to usage on the plateform after 2015. The current usage metrics is available 48-96 hours after online publication and is updated daily on week days.
Initial download of the metrics may take a while.