Fig. 3.
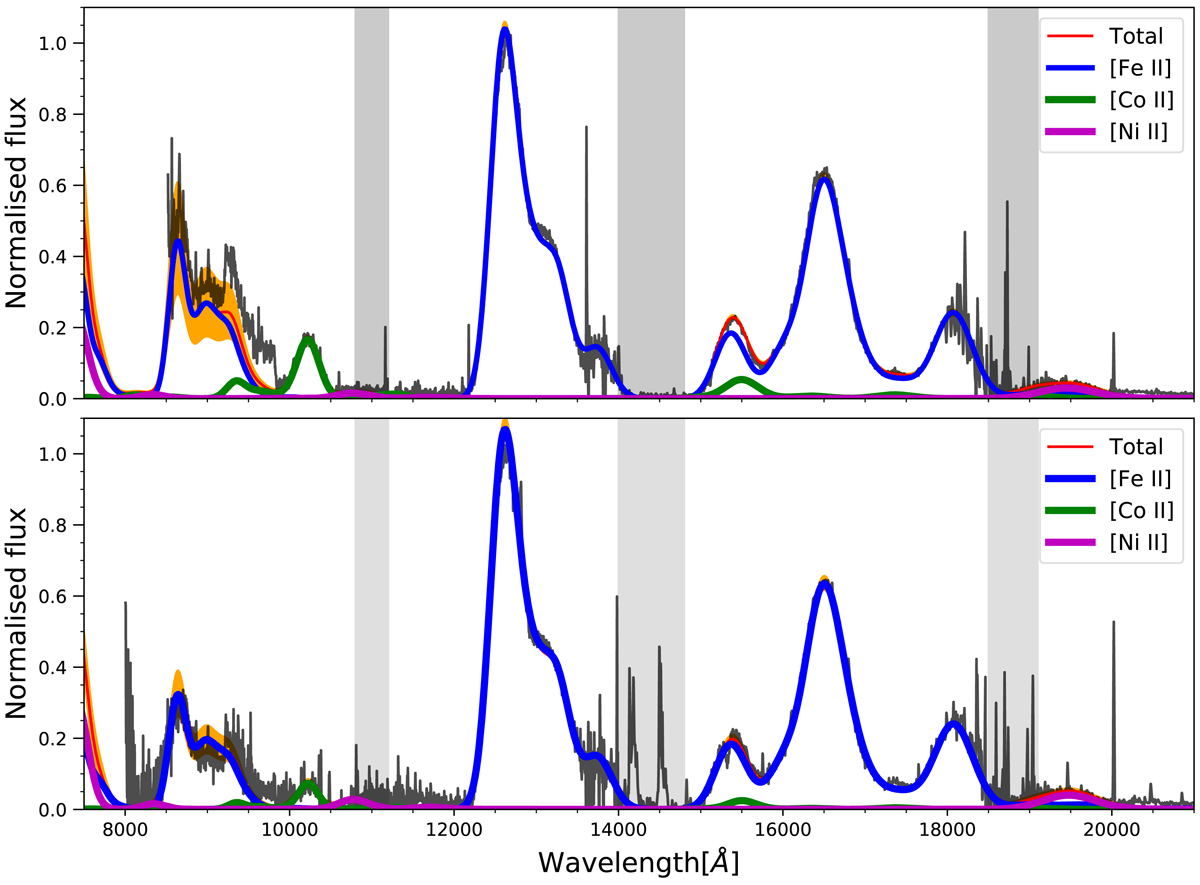
Fits to the observations using a NLTE one zone emission code. Top: April and bottom: May spectra. The red lines indicate the mean model. The orange shaded band shows the 95% credibility region. Ion contributions are shown in blue ([Fe II]), green ([Co II]) and magenta ([Ni II]). The atmospheric absorption bands shortwards of 1.12, 1.48 and 1.915 μm are shaded grey. The resulting values for the temperature and electron density for April spectrum are 3700 ± 400 K and 2.18 (±0.56) × 105 cm−3 and 3300 ± 200 K and 1.69 (±0.59) × 105 cm−3.
Current usage metrics show cumulative count of Article Views (full-text article views including HTML views, PDF and ePub downloads, according to the available data) and Abstracts Views on Vision4Press platform.
Data correspond to usage on the plateform after 2015. The current usage metrics is available 48-96 hours after online publication and is updated daily on week days.
Initial download of the metrics may take a while.