Fig. 1.
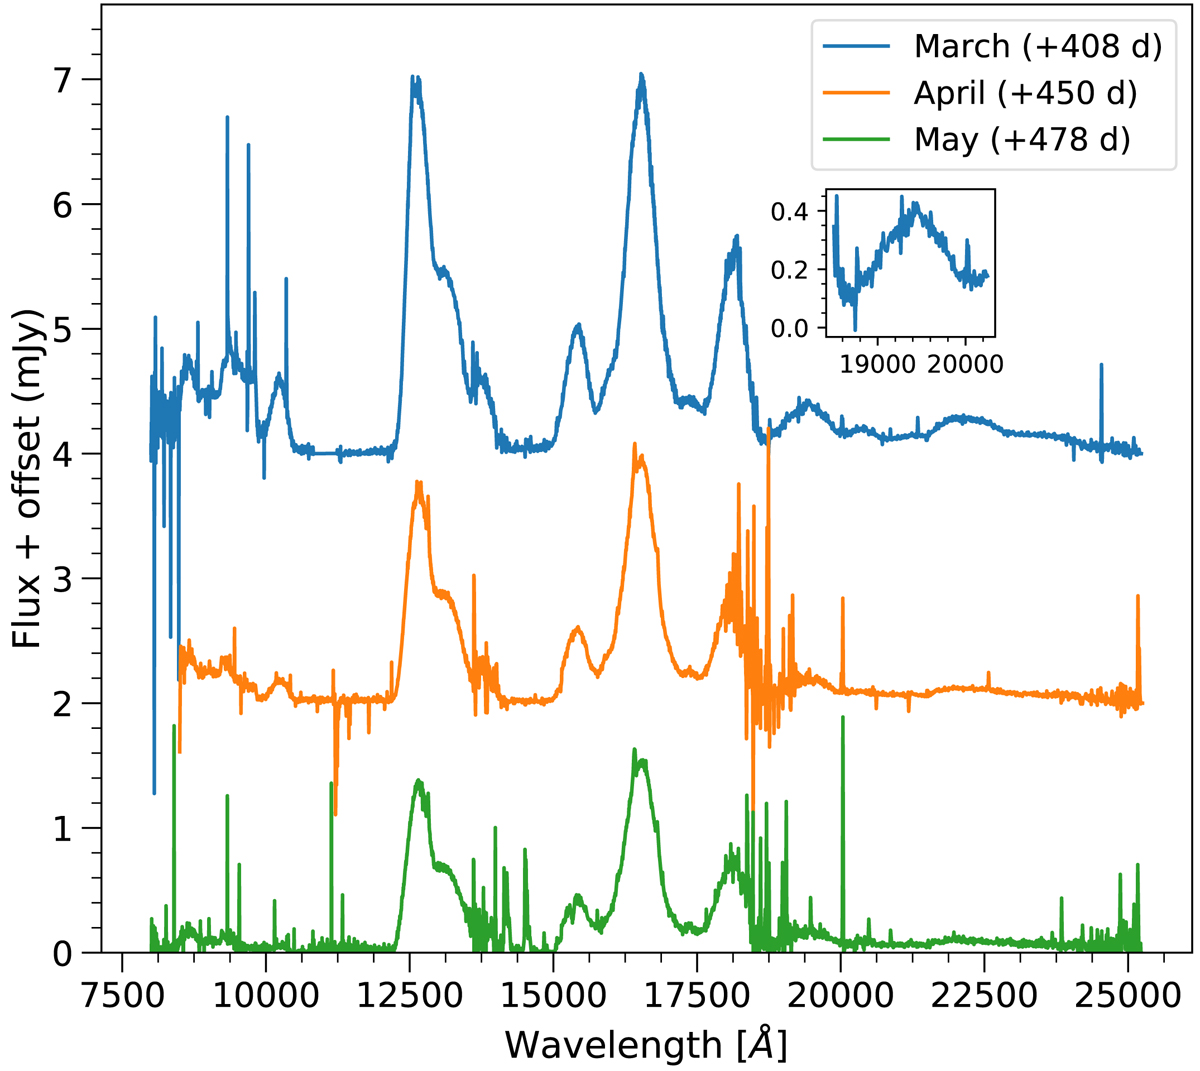
NIR spectra of SN 2014J (for the three nights it was observed). The spectra are plotted in mJy for visibility and each spectrum is incrementally displaced vertically by 2 mJy. The March data are at top and the May data at the bottom. The regions of poor atmospheric transmission around 1.4 and 1.9 μm are clearly identifiable due to the increased noise. The inset shows the region between 1.85 and 2.03 μm (the expected region for the [Ni II] feature) in the March spectrum.
Current usage metrics show cumulative count of Article Views (full-text article views including HTML views, PDF and ePub downloads, according to the available data) and Abstracts Views on Vision4Press platform.
Data correspond to usage on the plateform after 2015. The current usage metrics is available 48-96 hours after online publication and is updated daily on week days.
Initial download of the metrics may take a while.