Fig. 2.
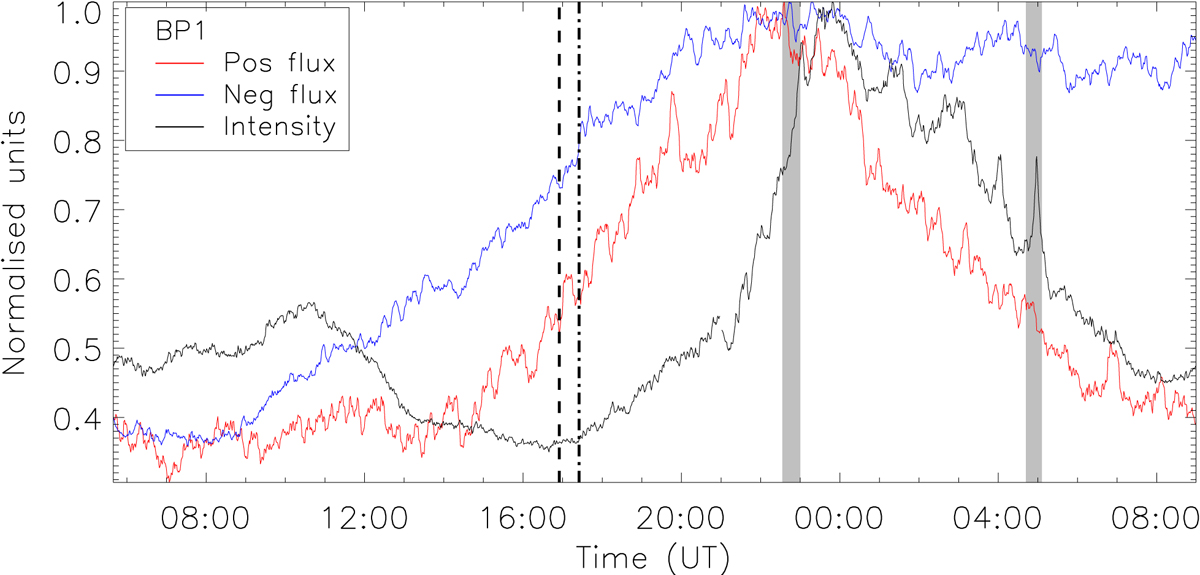
BP1: Light curves of the normalized total magnetic positive (red solid line) and negative (blue solid line) flux from the region outlined with a box in the very right panel of the top row in Fig. 1. The solid black line shows the normalized total intensity in the AIA 193 Å channel from the region outlined with a box in the third panel of the top row in Fig. 1. The grey areas show the eruption time, the dashed line the start of the flux emergence, and the dashed-dotted line, the time of the BP appearance in the AIA 193 Å images.
Current usage metrics show cumulative count of Article Views (full-text article views including HTML views, PDF and ePub downloads, according to the available data) and Abstracts Views on Vision4Press platform.
Data correspond to usage on the plateform after 2015. The current usage metrics is available 48-96 hours after online publication and is updated daily on week days.
Initial download of the metrics may take a while.