Fig. 5.
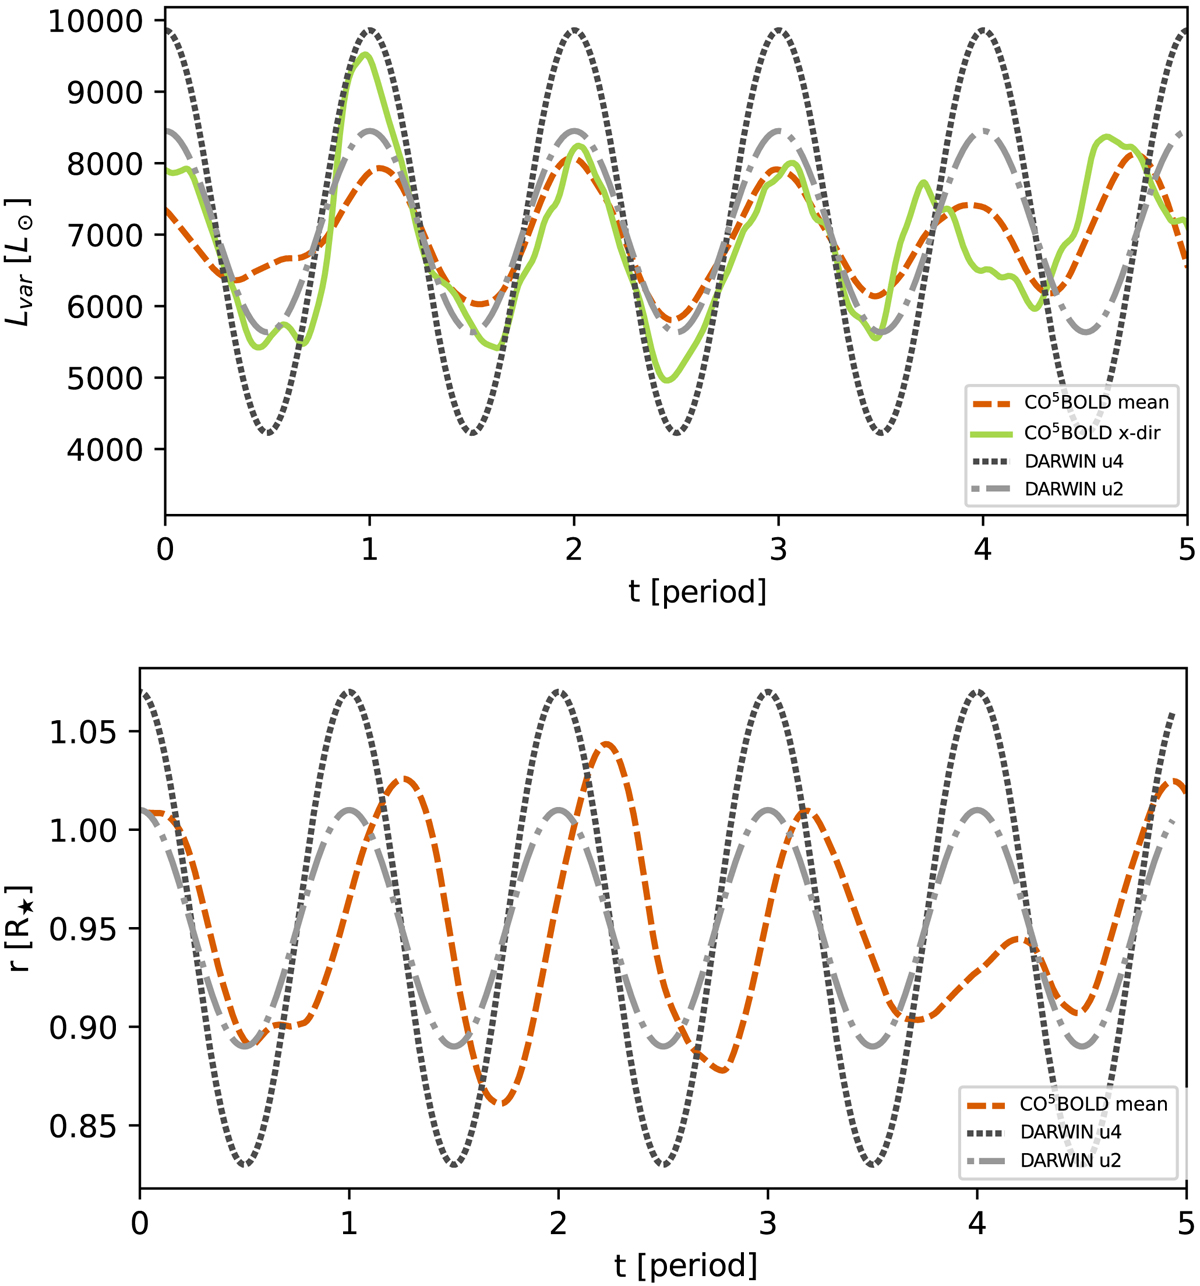
Top: comparison of the luminosity variation of the CO5BOLD model st28gm06n26, both averaged over all directions (orange) and only in the +x direction (green), as well as the luminosity variation of the DARWIN l70t27 up = 2km s−1 and 4 km s−1 models (grey and black). Bottom: comparison of the inner-most mass shells, representing the inner radial boundary, of the DARWIN l70t27 up = 2km s−1 and 4 km s−1 models (grey and black) and the mass shell at a comparable distance from the CO5BOLD model st28gm06n26, averaged over all directions (orange). This is the same time-interval as the top panel of Fig. 6.
Current usage metrics show cumulative count of Article Views (full-text article views including HTML views, PDF and ePub downloads, according to the available data) and Abstracts Views on Vision4Press platform.
Data correspond to usage on the plateform after 2015. The current usage metrics is available 48-96 hours after online publication and is updated daily on week days.
Initial download of the metrics may take a while.