Fig. 3
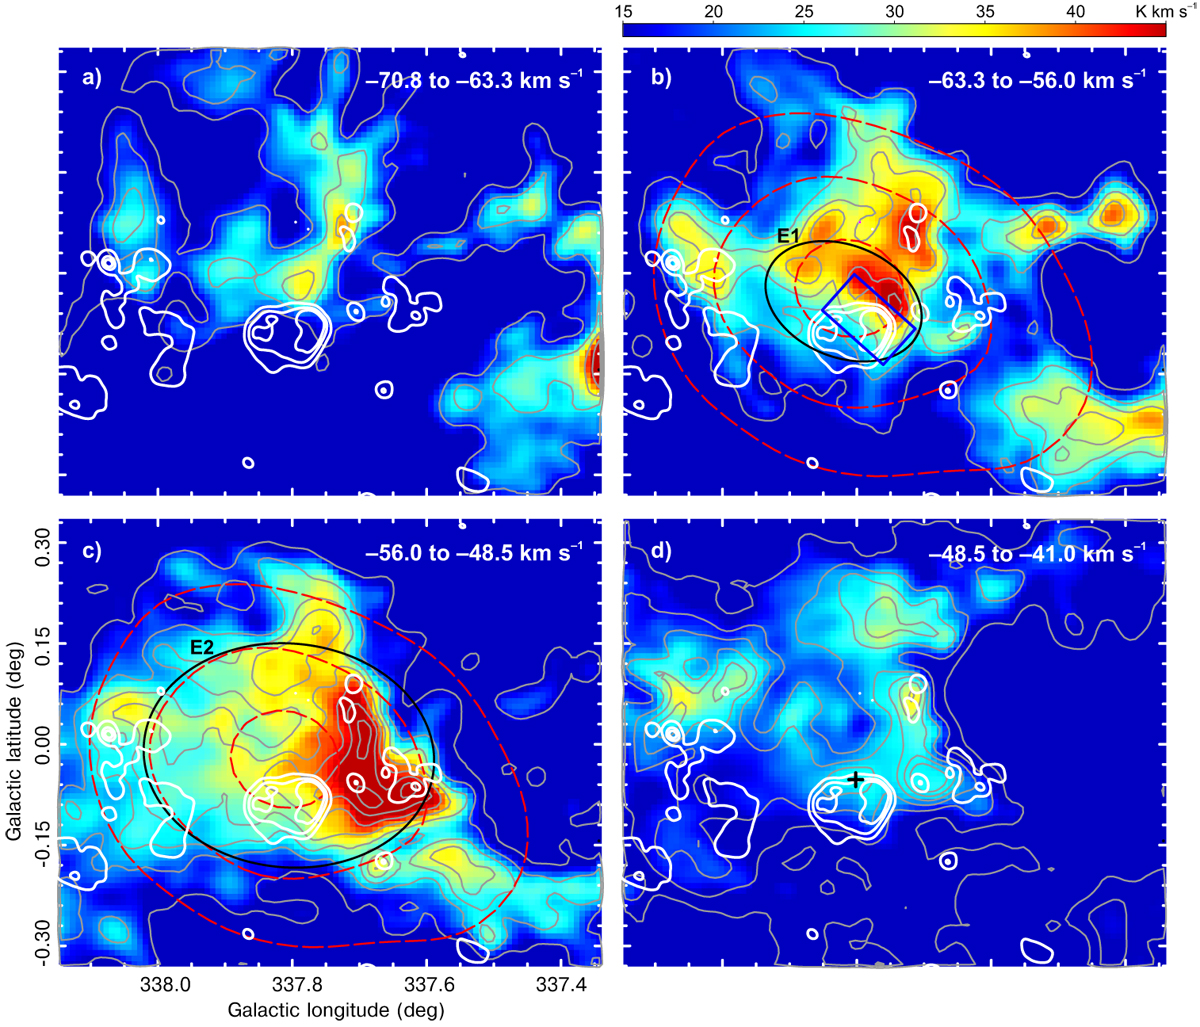
Molecular gas distribution as traced by the 12CO (J = 1– 0; in colours) and the 13CO (J = 1– 0; in gray contours) data from the Mopra Survey. The range of velocities is indicated at the top right corner of the panels. To facilitate the multiwavelength correlations between the remnant Kes 41, the star-forming regions, and the γ-ray emitting area with their surroundings, the same radio contours (in white) as in Fig. 2 were included in each panel. The γ-ray emission is drawn as red contours at 20, 24, and 27σ (Supan et al. 2018) only in panels b and c. The areas used in Sect. 3.3 to calculate the ambient properties are represented by the ellipses E1 and E2 included in panels b and c, respectively. The blue rectangle included in panel b marks the smaller field studied by Zhang et al. (2015). The plus in panel d marks the OH maser spot (Koralesky et al. 1998).
Current usage metrics show cumulative count of Article Views (full-text article views including HTML views, PDF and ePub downloads, according to the available data) and Abstracts Views on Vision4Press platform.
Data correspond to usage on the plateform after 2015. The current usage metrics is available 48-96 hours after online publication and is updated daily on week days.
Initial download of the metrics may take a while.