Fig. 2
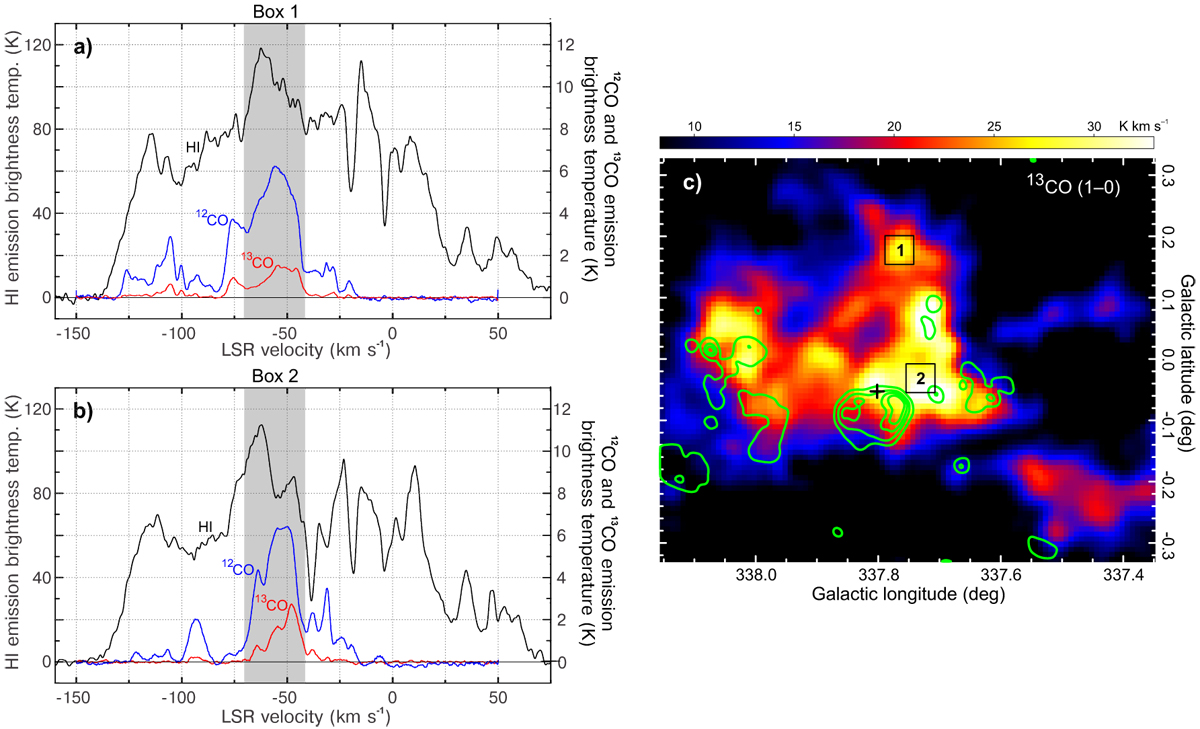
Panels a and b: test CO and HI 21 cm spectra towards two selected regions, labelled Box 1 and 2, used to determine the distance to the γ-ray emitting molecular gas. Both areas are depicted in panel c. The shaded area corresponds to the LSR velocities in which the molecular emission is dominant. The correspondence between the atomic and molecular emission indicates that the molecular material in Box 1 is located at the far kinematic distance of ~12 kpc. We found similar results (not shown here) across most of the CO distribution corresponding to the large cloud. HI self-absorption inside Box 2 revealed that superposed along the line of sight are a few molecular componentsthat lie in front of the large cloud (see discussion in the text). Panel c: integrated channel map of 13 CO (J = 1– 0) from the Mopra Survey data over LSR velocities range from −71 to − 41 km s−1 (the velocity interval shaded in panels a and b). Contours at the 0.09, 0.3, 0.5, and 0.7 Jy beam−1 (in green) from the 843 MHz SUMSS data were included to facilitate the comparison. The plus marks the OH maser spot (Koralesky et al. 1998).
Current usage metrics show cumulative count of Article Views (full-text article views including HTML views, PDF and ePub downloads, according to the available data) and Abstracts Views on Vision4Press platform.
Data correspond to usage on the plateform after 2015. The current usage metrics is available 48-96 hours after online publication and is updated daily on week days.
Initial download of the metrics may take a while.