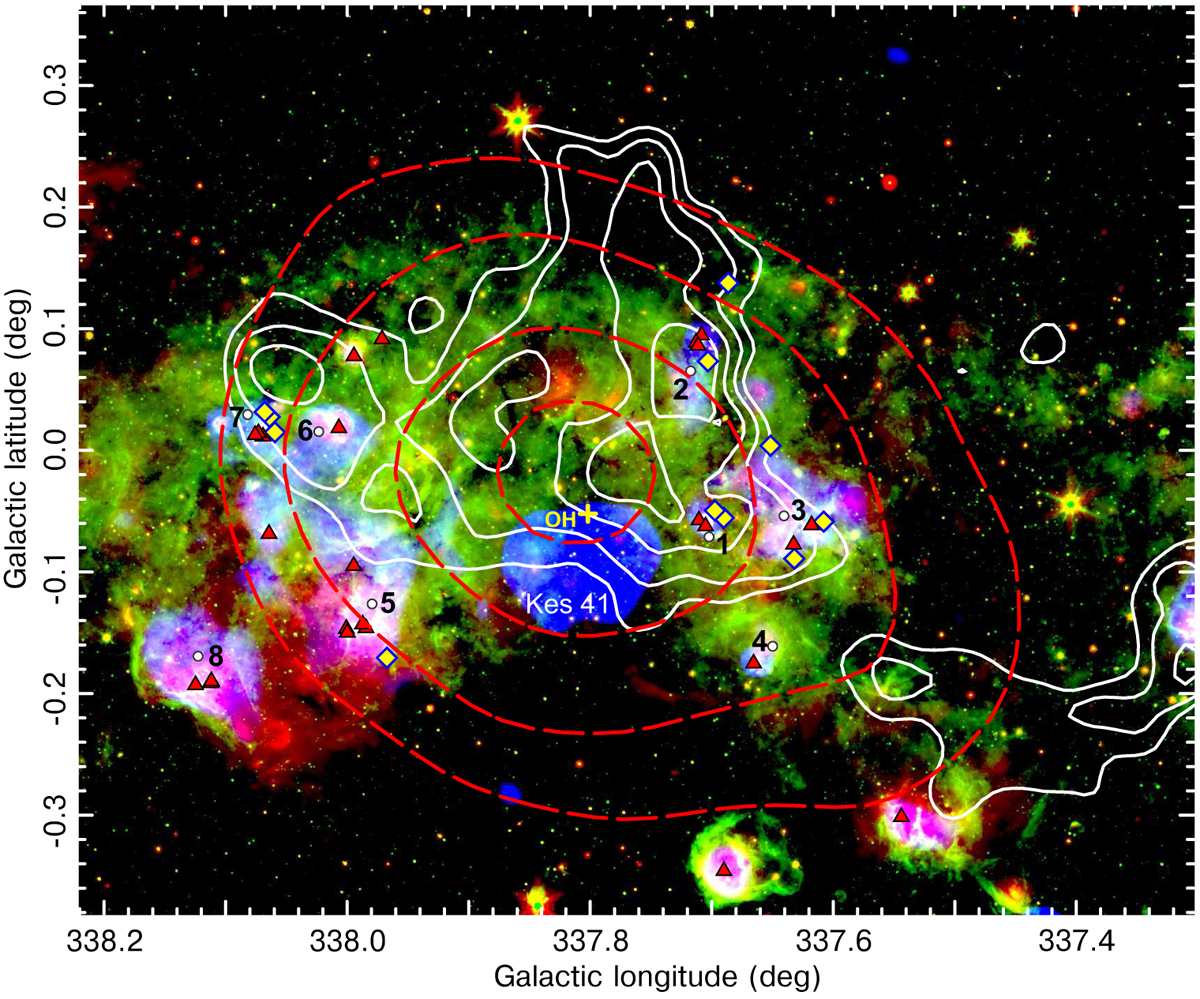
Fig. 1

Large-scale three-colour intensity map of the γ-ray emitting region around SNR Kes 41: mid-infrared data at 8 and 24 μm from MIPSGAL and GLIMPSE Spitzer are displayed in green and red, respectively, while the radio continuum emission at 843 MHz from Kes 41 and the HII regions is shown in blue. Dashed red contours correspond to statistical significances of 20, 22, 25, and 27σ determined from the re-analysis of the γ-rays photons detected by Fermi-LAT in the 0.5–400 GeV energy range (Supan et al. 2018). White contours trace the molecular gas emission in the 12CO (J = 1– 0) line integrated from −71 to −41 km s−1 at levels of 87, 101, 119, and 137 K km s−1. Objects are labelled with their names or numbers (see also information in Table A.1): Kes 41 and the OH maser (Koralesky et al. 1998; in blue); HII regions (numbers from 1 to 8; Jones & Dickey 2012); Class II 6.7 GHz CH3 OH masers (filled yellow diamonds; Caswell et al. 2011); and massive young stellar object candidates (upright filled red triangles; Lumsden et al. 2013).
Current usage metrics show cumulative count of Article Views (full-text article views including HTML views, PDF and ePub downloads, according to the available data) and Abstracts Views on Vision4Press platform.
Data correspond to usage on the plateform after 2015. The current usage metrics is available 48-96 hours after online publication and is updated daily on week days.
Initial download of the metrics may take a while.


