Fig. 3.
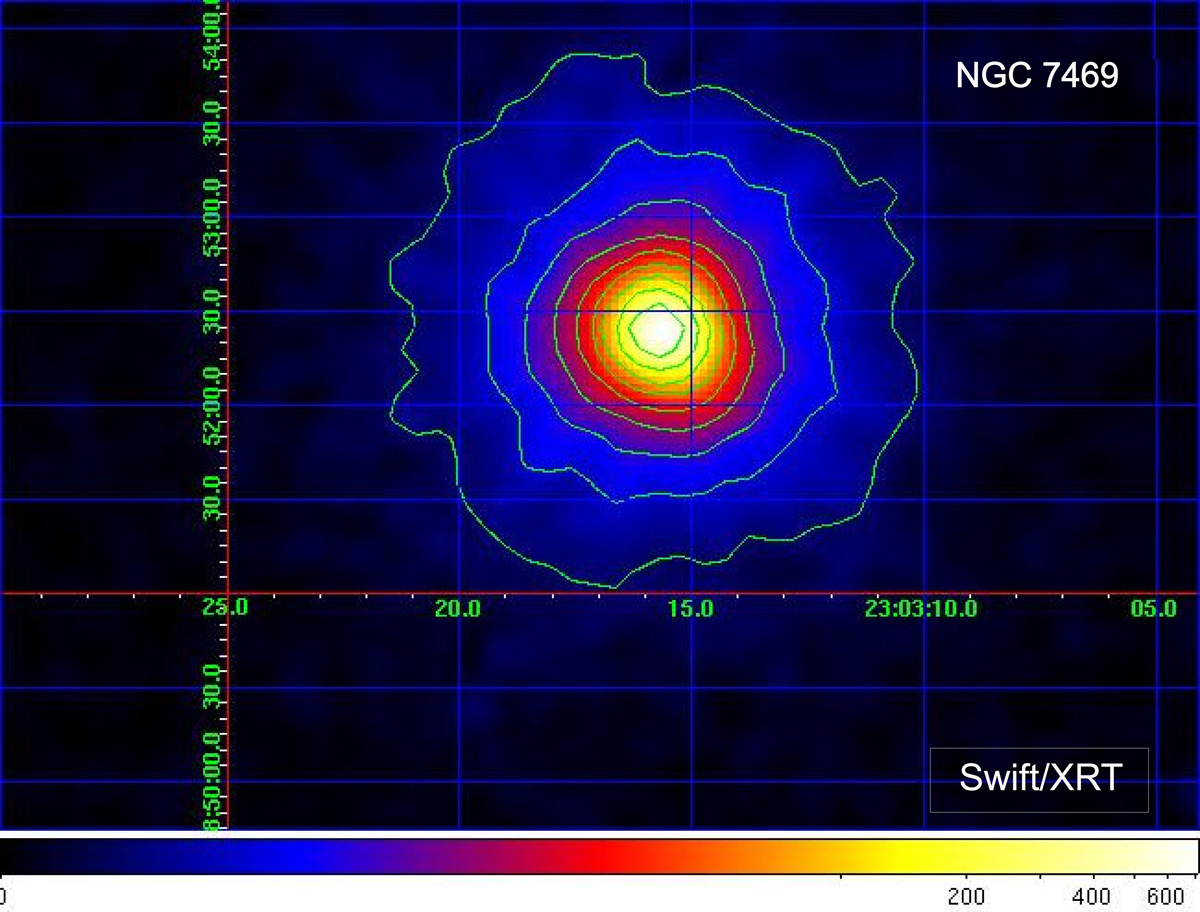
Adaptively smoothed Swift/XRT image of the soft X-ray emission (0.3–10 keV) of NGC 7469 field, of which localization is indicated by the selected yellow dashed-line box in Fig. 2. Contours correspond to nine logarithmic intervals in the range of 0.003–5% with respect to the brightest pixel, and contour levels demonstrate the minimal contamination by other point sources and diffuse emission.
Current usage metrics show cumulative count of Article Views (full-text article views including HTML views, PDF and ePub downloads, according to the available data) and Abstracts Views on Vision4Press platform.
Data correspond to usage on the plateform after 2015. The current usage metrics is available 48-96 hours after online publication and is updated daily on week days.
Initial download of the metrics may take a while.