Fig. 1.
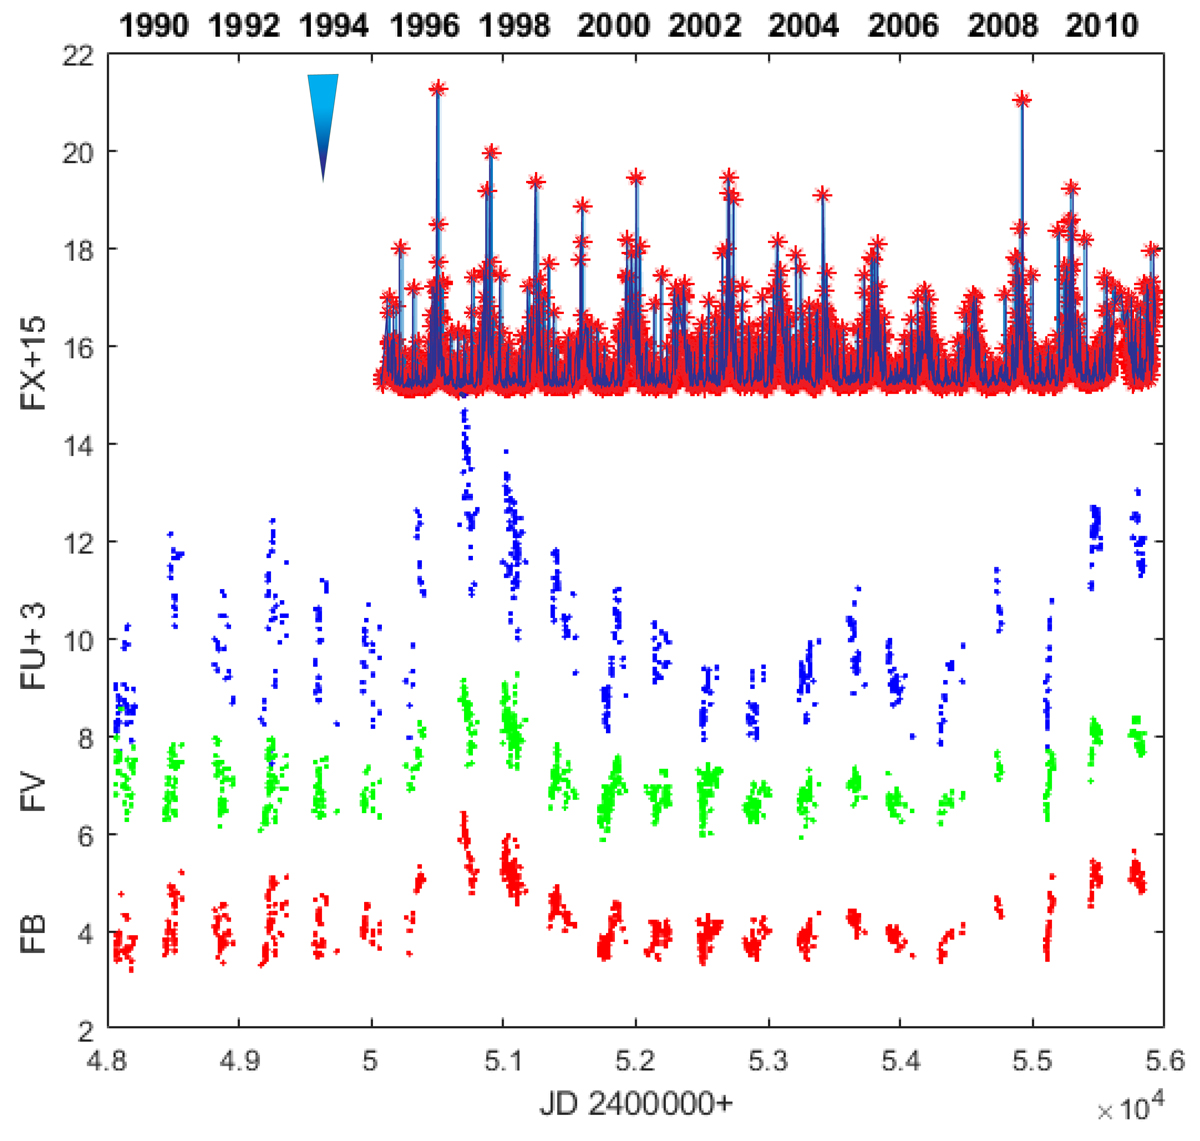
X-ray light curve of NGC 7469 in the 2–12 keV energy range (1996–2011) is presented on the top. The bright blue triangle (arrow) indicates the ASCA observation MJD. The rate axis for the upper light curve (red stars) is related to the RXTE/ASM count rate increased by 15 units for clarity. In the three bottom panels the optical light curves (in 10−15 erg cm−2 s−1 Å−1) of NGC 7469 in the U (blue), V (green), and B (red) filters during 1995–2012 are presented. For clarity, the flux for the U-filter is increased by three units.
Current usage metrics show cumulative count of Article Views (full-text article views including HTML views, PDF and ePub downloads, according to the available data) and Abstracts Views on Vision4Press platform.
Data correspond to usage on the plateform after 2015. The current usage metrics is available 48-96 hours after online publication and is updated daily on week days.
Initial download of the metrics may take a while.