Fig. 9
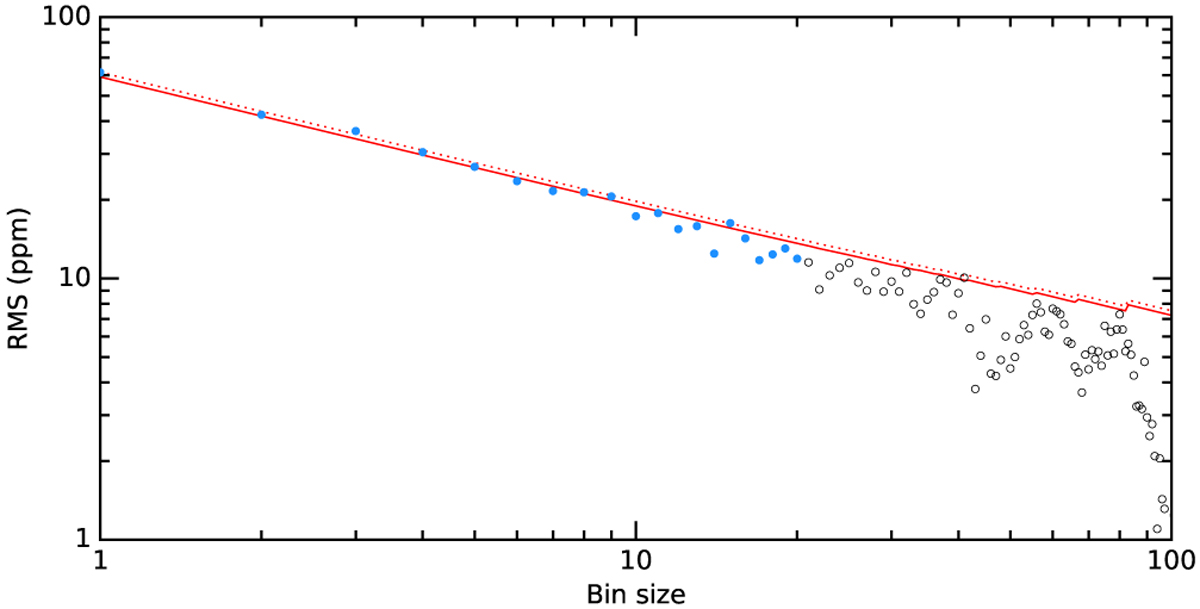
RMS of binned residuals between the combined STIS visits and their best-fit model, as a function of bin size. The solid red line shows the best-fit noise model (quadratic combination of a Gaussian “white” noise and a constant correlated “red” noise), which was fitted over the blue measurements. The dotted red line shows a pure Gaussian noise model scaled to the RMS over individual exposures.
Current usage metrics show cumulative count of Article Views (full-text article views including HTML views, PDF and ePub downloads, according to the available data) and Abstracts Views on Vision4Press platform.
Data correspond to usage on the plateform after 2015. The current usage metrics is available 48-96 hours after online publication and is updated daily on week days.
Initial download of the metrics may take a while.