Free Access
Fig. 8
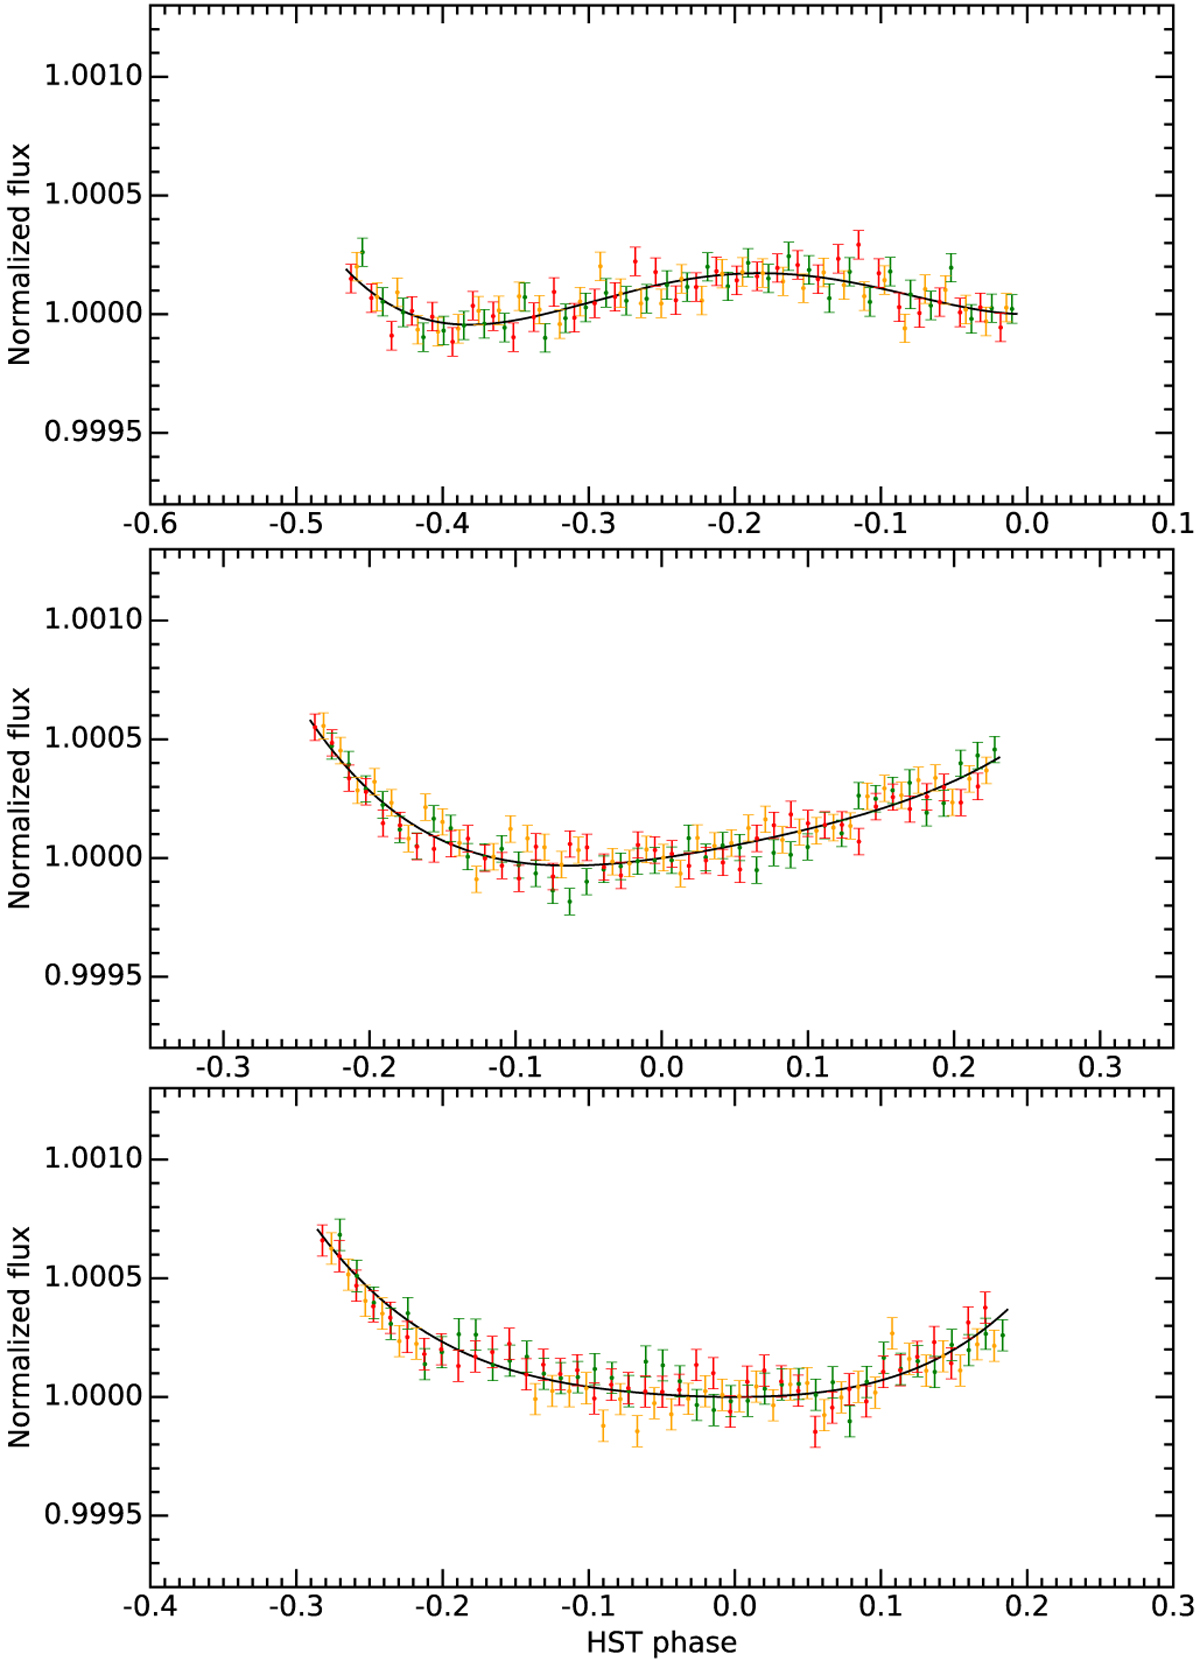
Visible flux of 55 Cnc phase-folded on the HST orbital period. Fluxes have been corrected for the long-term variations and transit light curve, to highlight the breathing variations (best-fitted with the solid black line). Color code is the same as in Fig. 7.
Current usage metrics show cumulative count of Article Views (full-text article views including HTML views, PDF and ePub downloads, according to the available data) and Abstracts Views on Vision4Press platform.
Data correspond to usage on the plateform after 2015. The current usage metrics is available 48-96 hours after online publication and is updated daily on week days.
Initial download of the metrics may take a while.