Fig. 6.
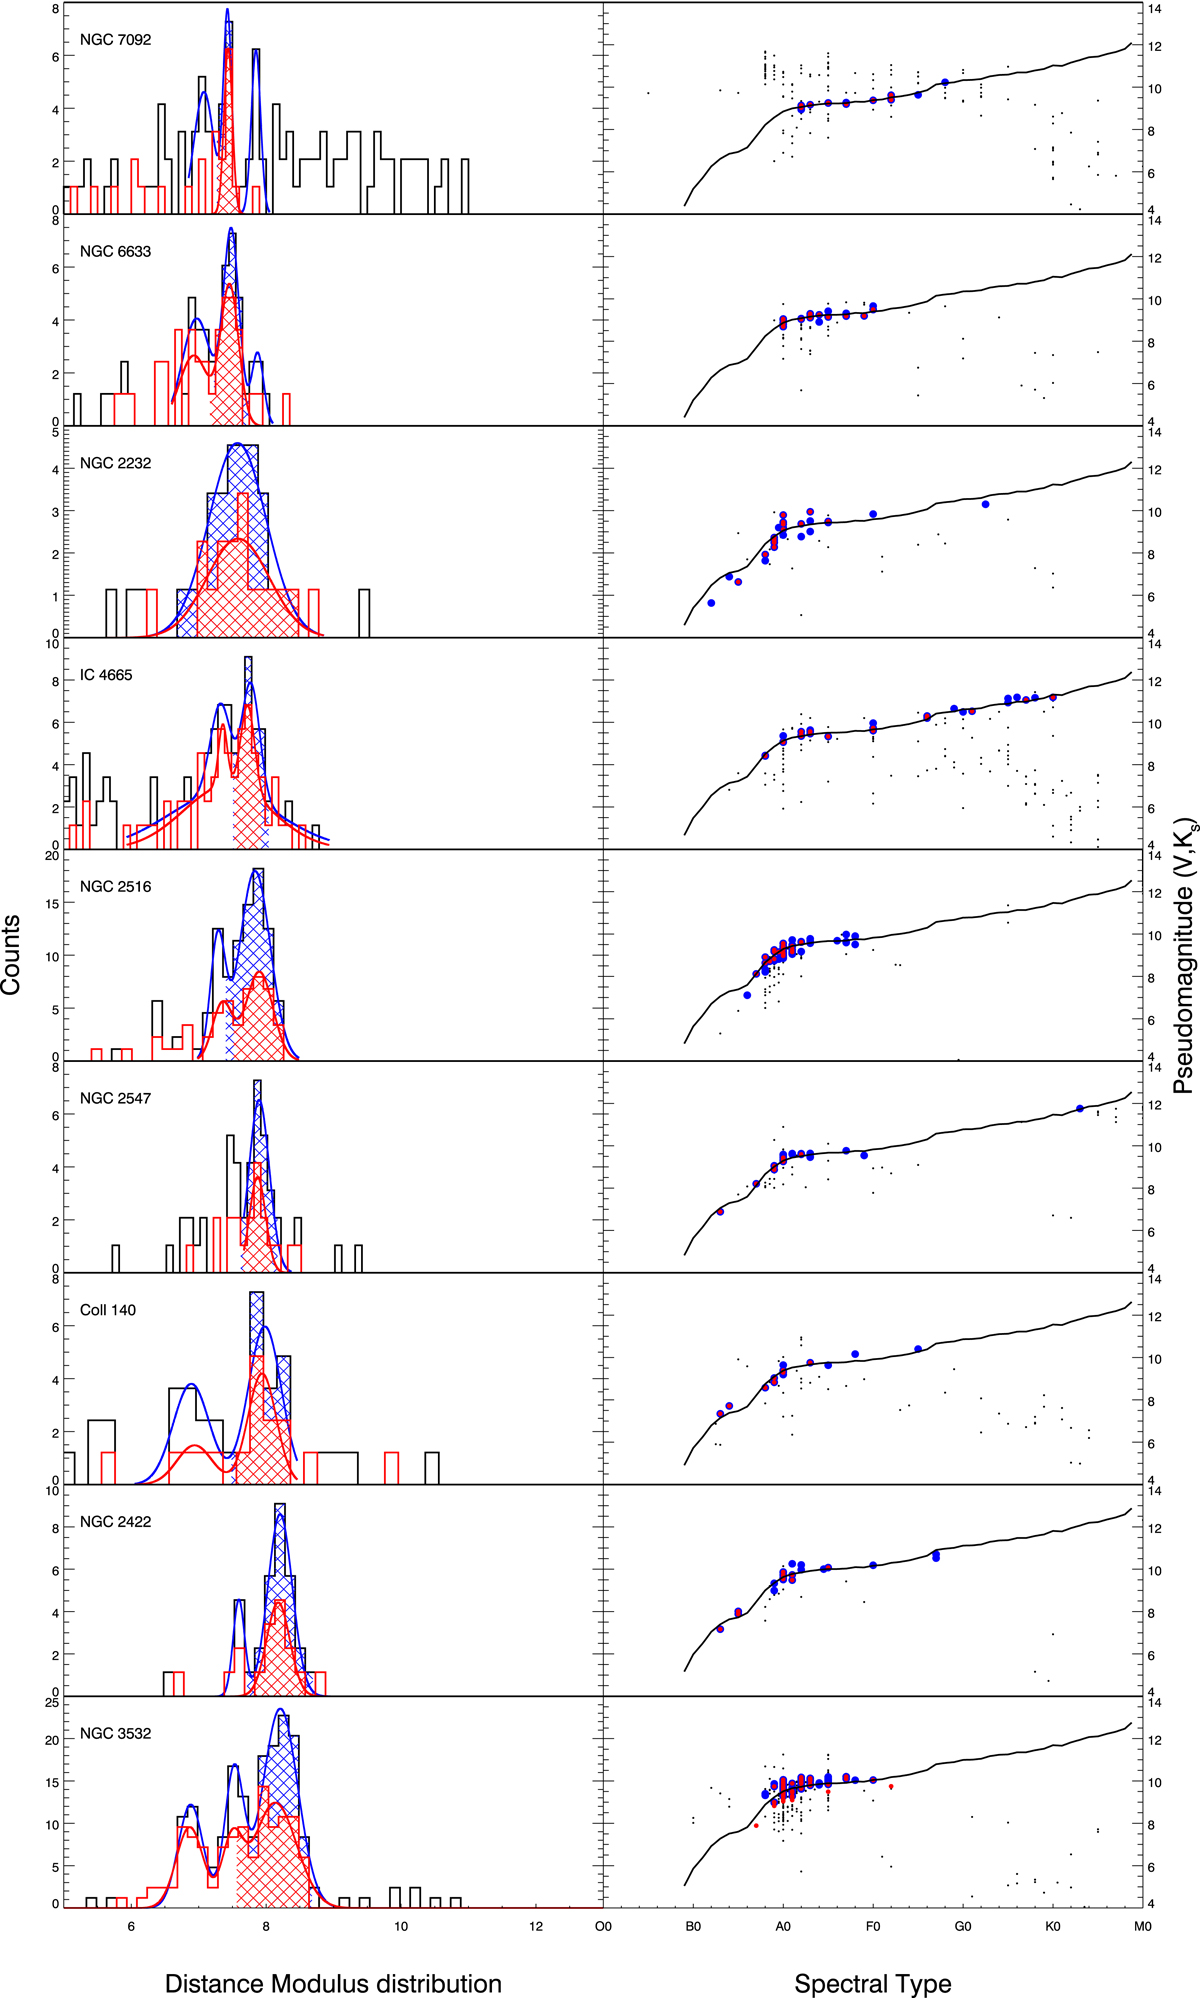
Left: pseudo-photometric distance distributions of open clusters from the list of fvl17 (first part: 10 clusters); black and red histograms: dd1 and dd2, without and with proper motion constraints, respectively (see text); full blue and red lines: Gaussian fits; the blue and red hatched regions correspond to the selected stars used to compute ppdm1 and ppdm2, respectively. Right: black points: (V,Ks) pseudomagnitudes as a function of spectral type; blue and red points: stars used to compute ppdm1 and ppdm2, respectively.
Current usage metrics show cumulative count of Article Views (full-text article views including HTML views, PDF and ePub downloads, according to the available data) and Abstracts Views on Vision4Press platform.
Data correspond to usage on the plateform after 2015. The current usage metrics is available 48-96 hours after online publication and is updated daily on week days.
Initial download of the metrics may take a while.