Fig. 2.
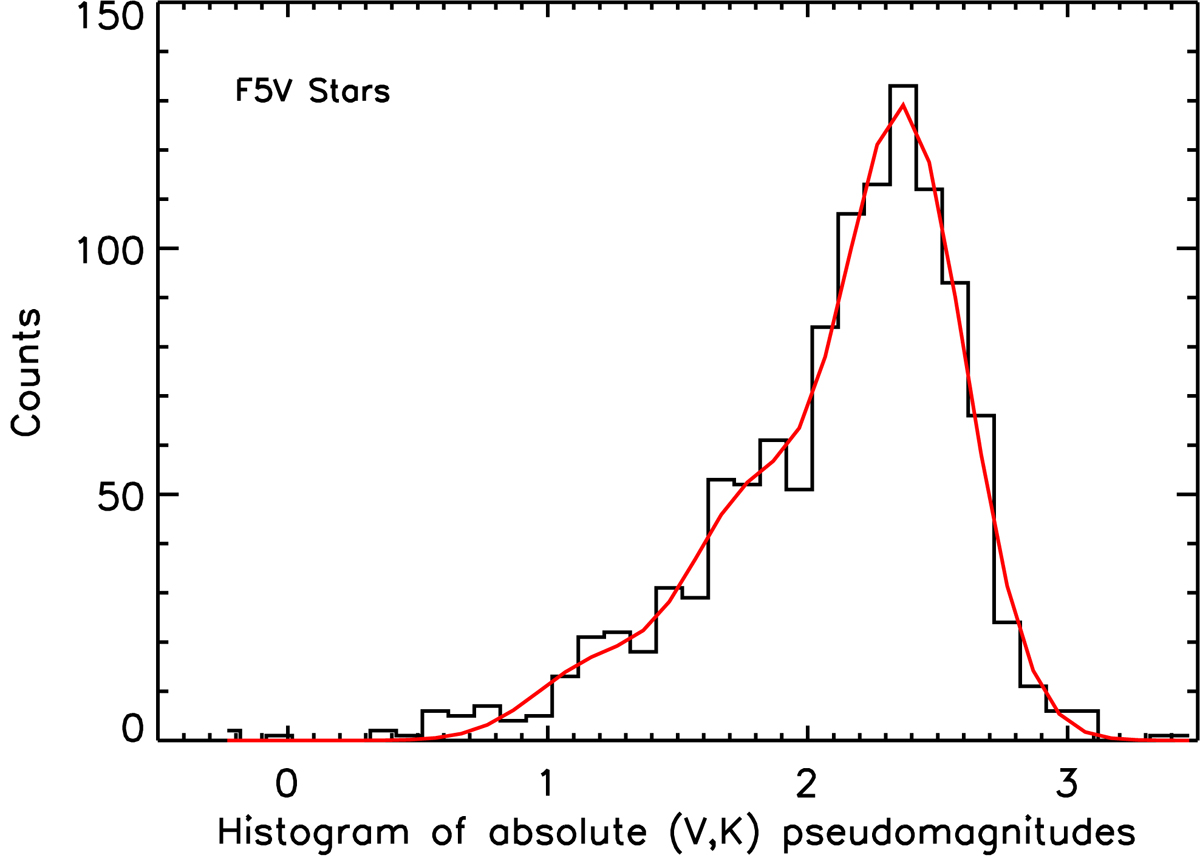
(V,Ks) APM distribution of the 1141 TGAS F5V stars located at a distance modulus smaller than six. The red curve represents the fit of the distribution with three Gaussian functions of the same variance. In this case, the positions of the secondary and the tertiary Gaussian functions are smaller by 0.63 and 1.26 mag with respect to that of the primary Gaussian function.
Current usage metrics show cumulative count of Article Views (full-text article views including HTML views, PDF and ePub downloads, according to the available data) and Abstracts Views on Vision4Press platform.
Data correspond to usage on the plateform after 2015. The current usage metrics is available 48-96 hours after online publication and is updated daily on week days.
Initial download of the metrics may take a while.