Fig. A.1.
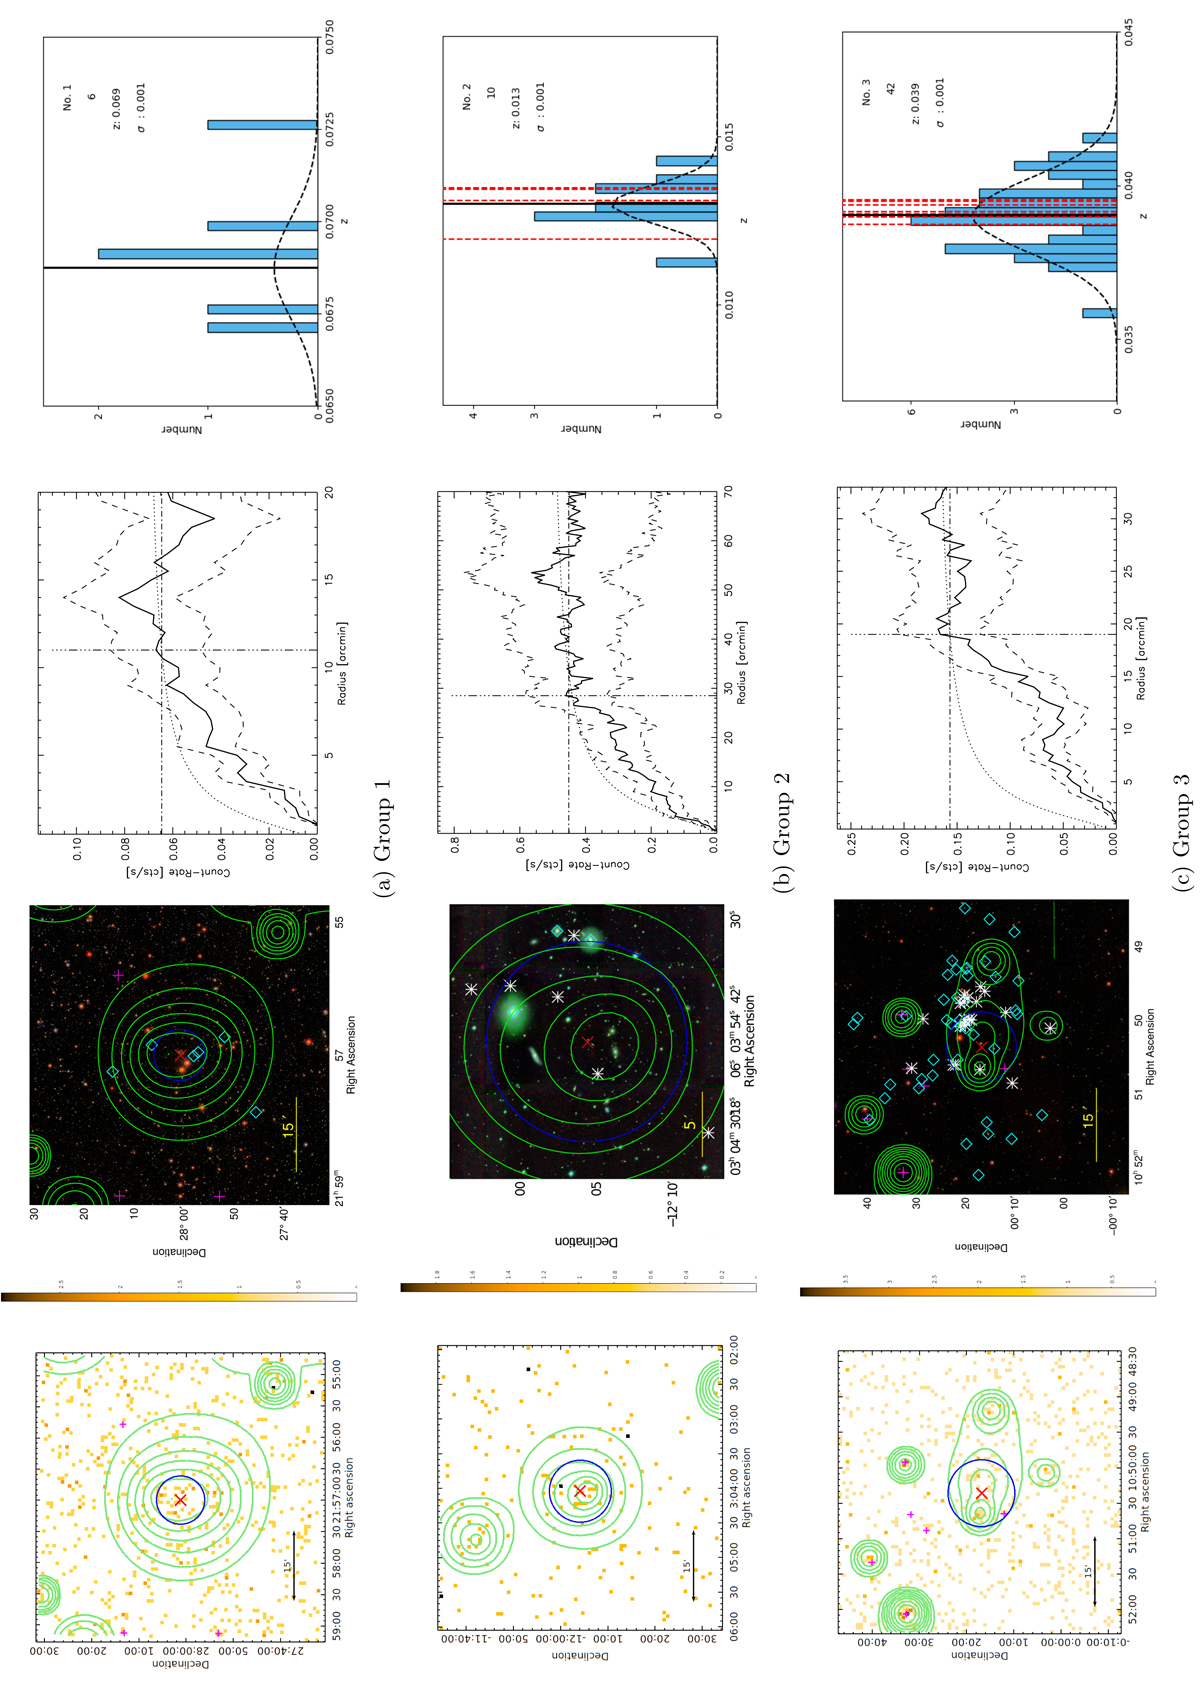
From left to right: RASS photon images (left), optical images, integrated count rates profiles, and spectroscopic redshift histograms (right) for the galaxy groups in our pilot sample. The optical images are from ATLAS (composed of g, r, i bands, group 2, 6, 10), SDSS (composed of g, r, i bands, group 1, 3, 7, 8, 9) or DSS (r band, other groups). The images have a 1 × 1 deg2 size, except for the ATLAS images, which are 0.30 × 0.30 deg2. The red cross shows the position of the group candidate. The magenta plus signs display the location of 1RXS or 2RXS sources. The cyan diamonds show the positions of galaxies used for redshift determination. The white asterisks show the positions of known optical galaxy groups/clusters obtained from NED. The green contours are obtained from the corresponding wavelet-filtered images, and the blue circle shows the extent value (i.e., the core radius) of the group. The integrated count rates profile is background subtracted (solid line). The dashed curves give the 1σ statistical error of the count rates. The vertical and horizontal dot-dashed lines indicate the aperture radius and the count rates used for the primary photometric results. The dotted curve shows the β model of the cluster modelling used to extrapolate to r500 (see Sect. 4.3.2 for further details). In the spectroscopic redshift histograms the redshift values are taken for all galaxies within a box of 1 × 1 deg2 centered on the group position with z < 0.10 from NED. The total number of galaxies used in each redshift determination is given by the second number displayed in the upper right corner of each panel (see also Table 3). The redshift distribution is fitted with a Gaussian function using 3σ clipping (black dashed curve). The final redshift of each group is taken from the peak of the fitting, and it is shown by the third number displayed in the upper-right corner of each panel and by the black solid line. The red lines show the redshifts of identified groups or clusters within 15 arcmin of the position of our candidates, red dashed line for spectroscopic redshift and the red dotted line for photometric redshift (see Sect. 5 for further details).
Current usage metrics show cumulative count of Article Views (full-text article views including HTML views, PDF and ePub downloads, according to the available data) and Abstracts Views on Vision4Press platform.
Data correspond to usage on the plateform after 2015. The current usage metrics is available 48-96 hours after online publication and is updated daily on week days.
Initial download of the metrics may take a while.