Free Access
Fig. 9.
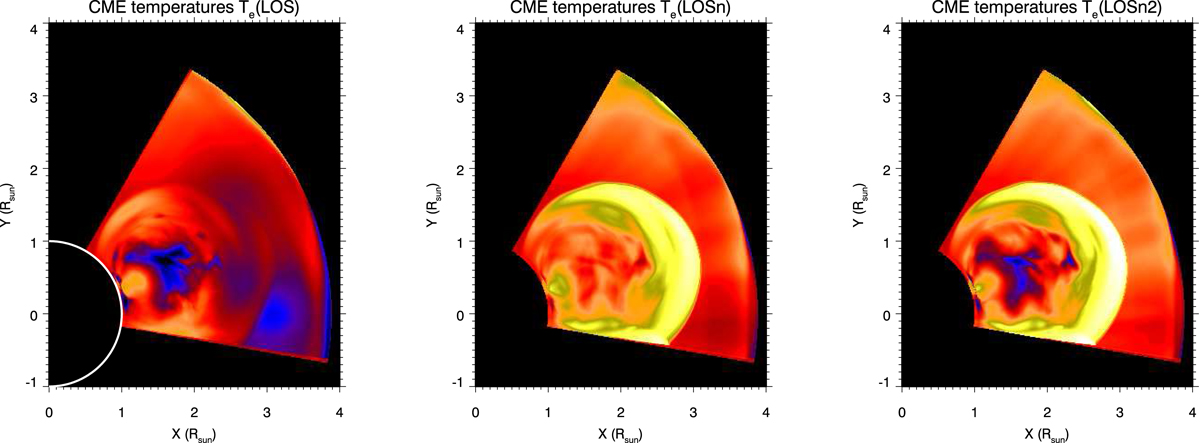
Distribution of input CME temperatures averaged along the LOS (Te (LOS), left panel), and making an average along the LOS weighted with density (Te (LOSn), middle panel) and density squared (Te (LOSn2), right panel). In all panels the scale is Logarithmic and goes from 105.5 K (black–dark blue) up to 107.5 K (yellow–white).
Current usage metrics show cumulative count of Article Views (full-text article views including HTML views, PDF and ePub downloads, according to the available data) and Abstracts Views on Vision4Press platform.
Data correspond to usage on the plateform after 2015. The current usage metrics is available 48-96 hours after online publication and is updated daily on week days.
Initial download of the metrics may take a while.