Free Access
Fig. 6.
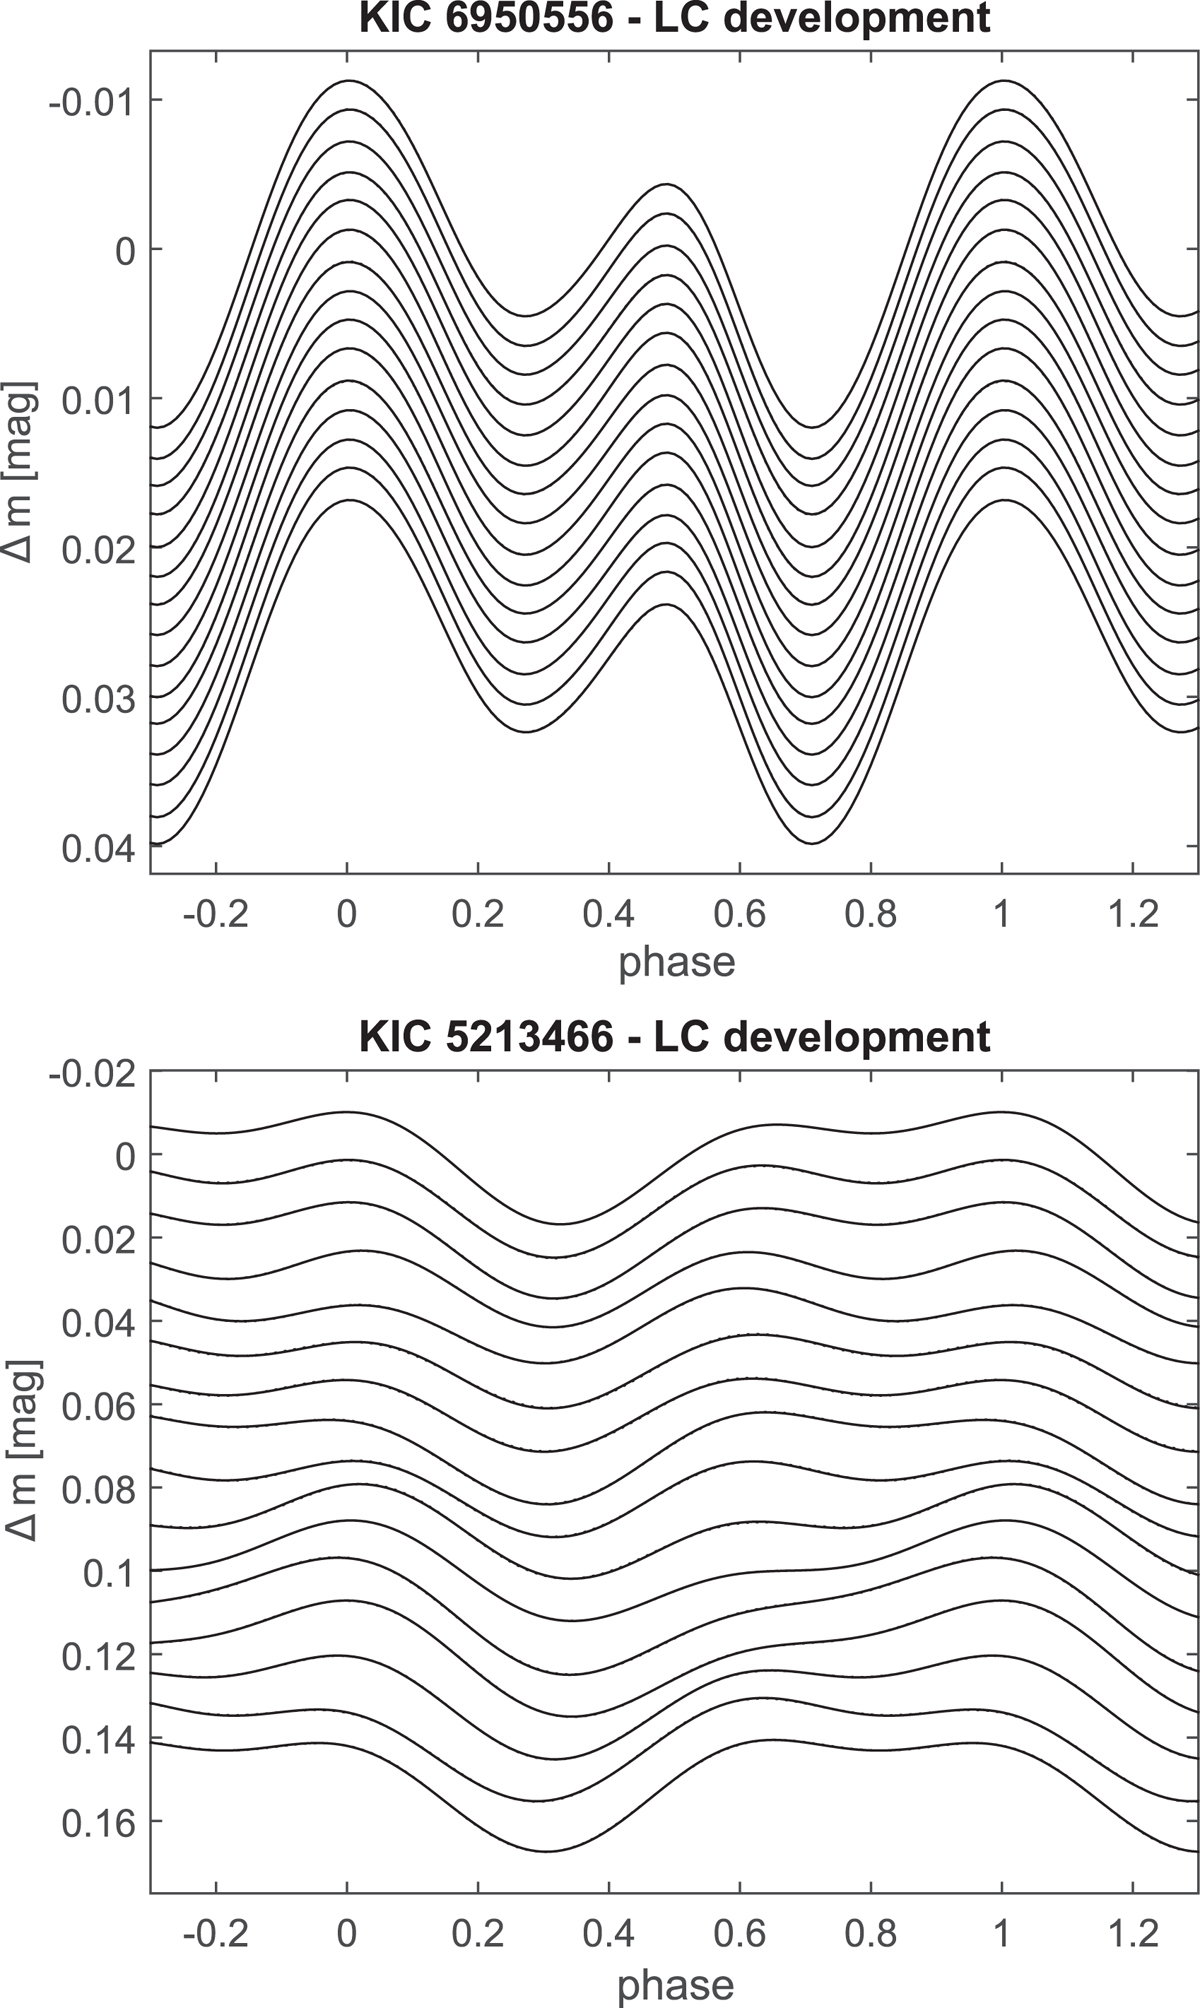
Light curve development of KIC 6950556 (A0 V Si; upper panel) and KIC 5213466 (A1 V; lower panel). The plots have been created with the DEVELOPMENT code and based on original, non-detrended Kepler PDC flux. The time distance between subsequent mean light curves is a quarter of a year.
Current usage metrics show cumulative count of Article Views (full-text article views including HTML views, PDF and ePub downloads, according to the available data) and Abstracts Views on Vision4Press platform.
Data correspond to usage on the plateform after 2015. The current usage metrics is available 48-96 hours after online publication and is updated daily on week days.
Initial download of the metrics may take a while.