Fig. A.1.
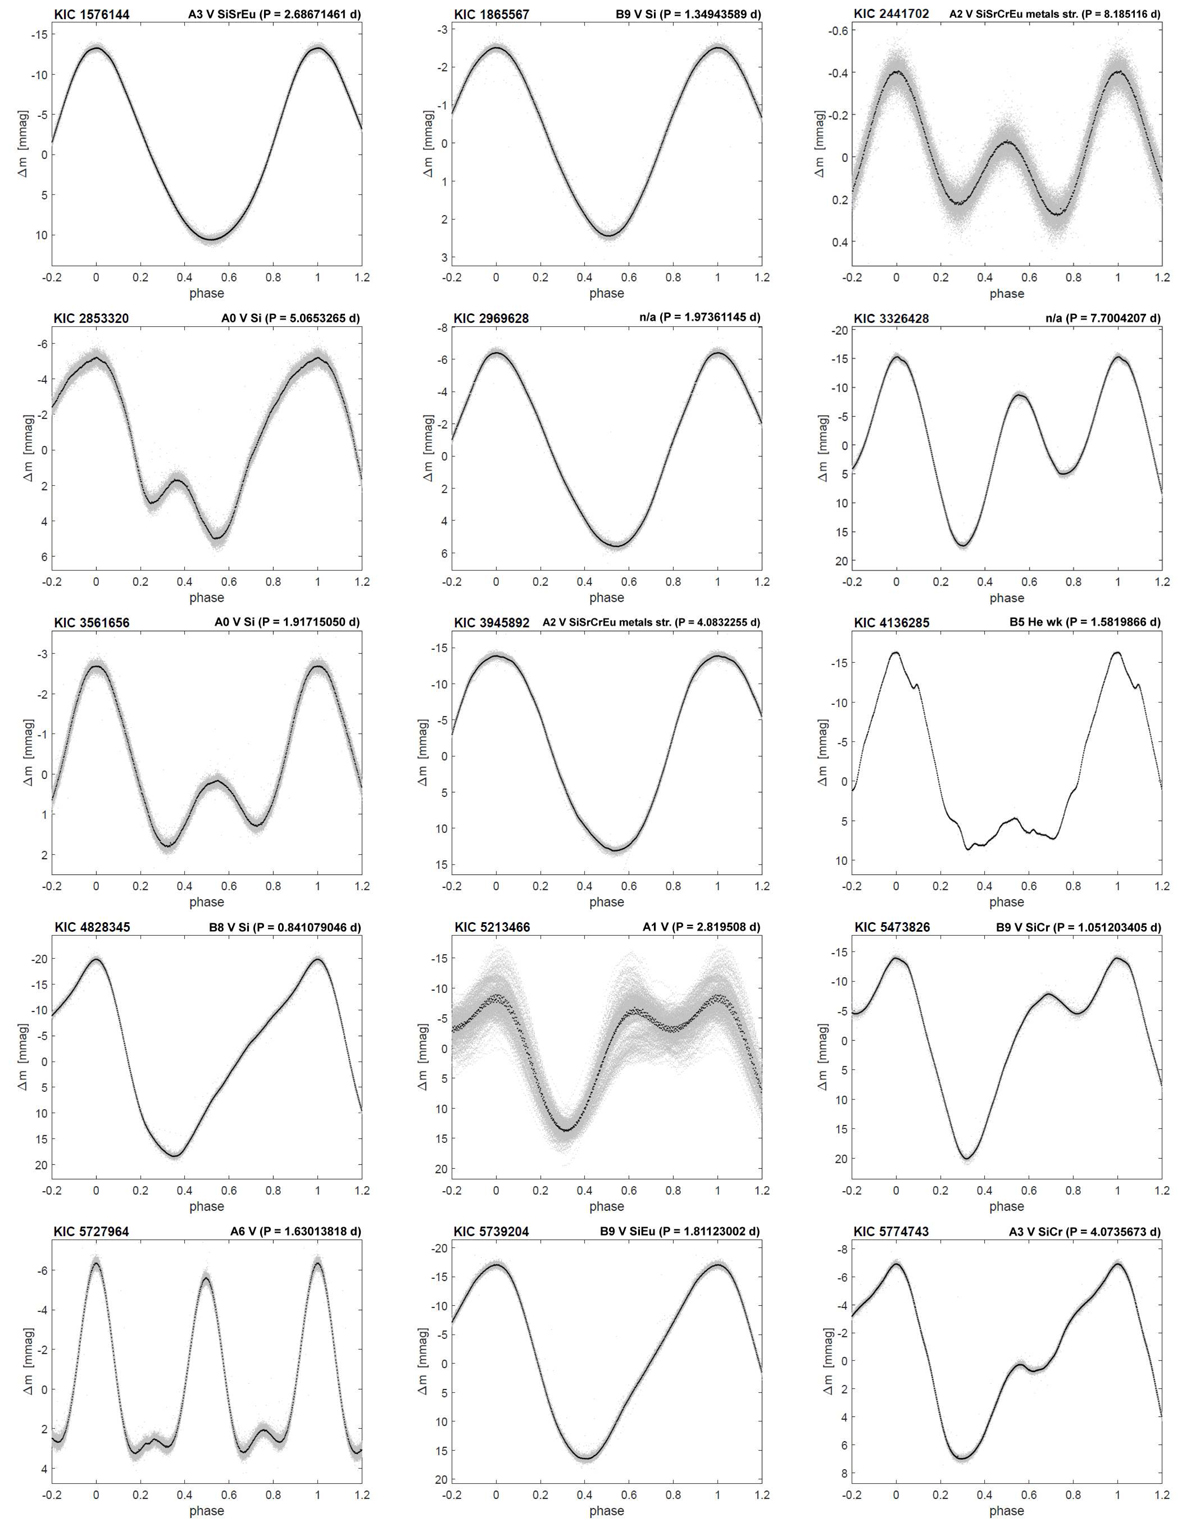
Light curves of all objects, based on detrended and rescaled Kepler data (cf. Sect. 2.6.2) and phased with the linear ephemerides presented in Table 4. The contours of the mean light curve are delineated by black dots. Phase zero corresponds to photometric maximum. The indicated periods and spectral types have been gleaned from Table 4. The given spectral types have been taken from Renson & Manfroid (2009; KIC 4136285), Murphy (1969; KIC 11560273), and this study (all other stars).
Current usage metrics show cumulative count of Article Views (full-text article views including HTML views, PDF and ePub downloads, according to the available data) and Abstracts Views on Vision4Press platform.
Data correspond to usage on the plateform after 2015. The current usage metrics is available 48-96 hours after online publication and is updated daily on week days.
Initial download of the metrics may take a while.