Fig. 6.
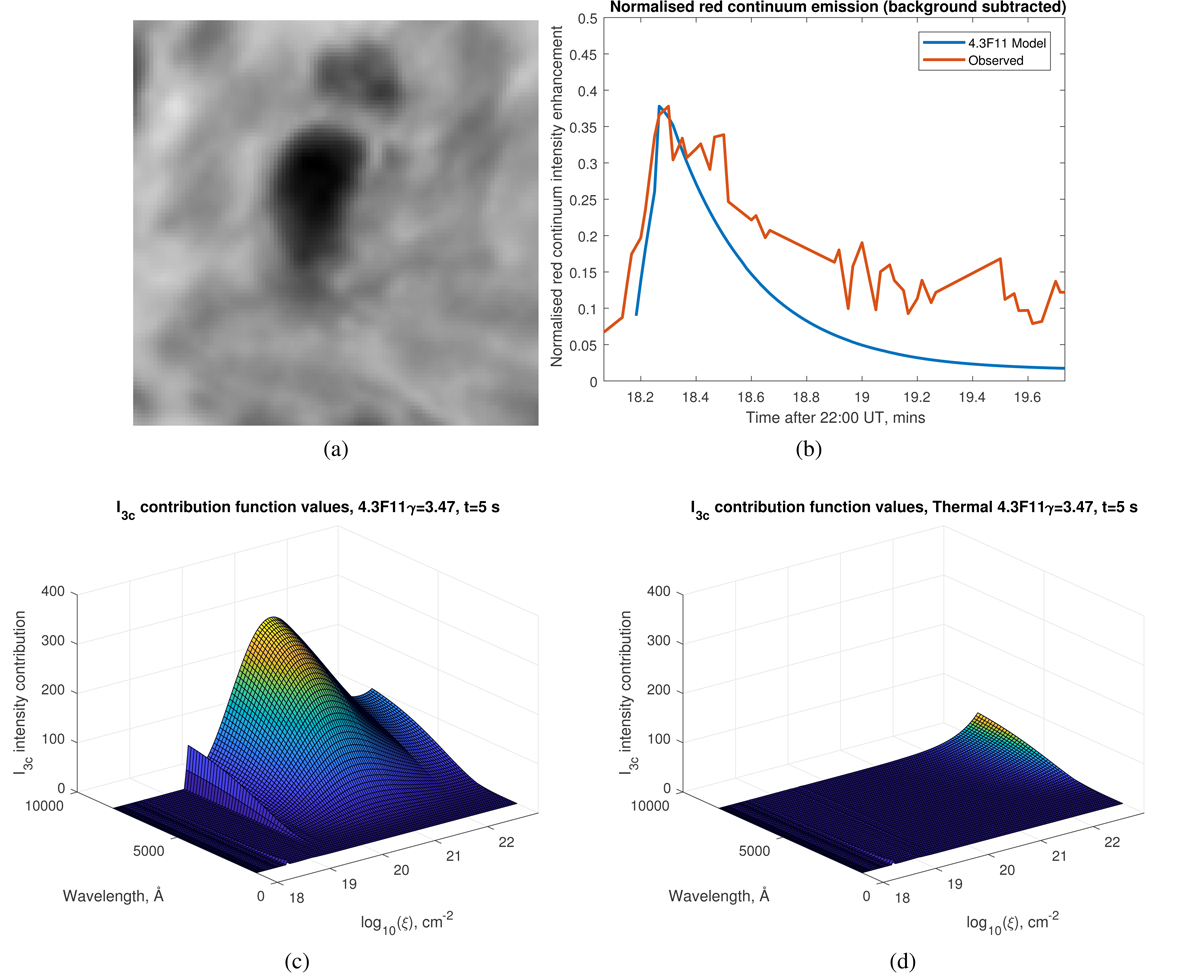
Top plots: panel a: close-up of the white light (WL) kernel 1 observed with the FISCH instrument Kawate et al. (2016) where the first HXR peak and sunquake occurred (see Fig. 1). Panel b: WL temporal profiles observed with the FISCH instrument Kawate et al. (2016) versus simulated from the hydrodynamic model presented in Fig. 4. Bottom plots: contribution functions of Paschen continuum simulated for the joint effect of thermal and nonthermal (beam) electrons 5 s after their injection onset (panel c) and for thermal electron only (panel d).
Current usage metrics show cumulative count of Article Views (full-text article views including HTML views, PDF and ePub downloads, according to the available data) and Abstracts Views on Vision4Press platform.
Data correspond to usage on the plateform after 2015. The current usage metrics is available 48-96 hours after online publication and is updated daily on week days.
Initial download of the metrics may take a while.