Fig. 7.
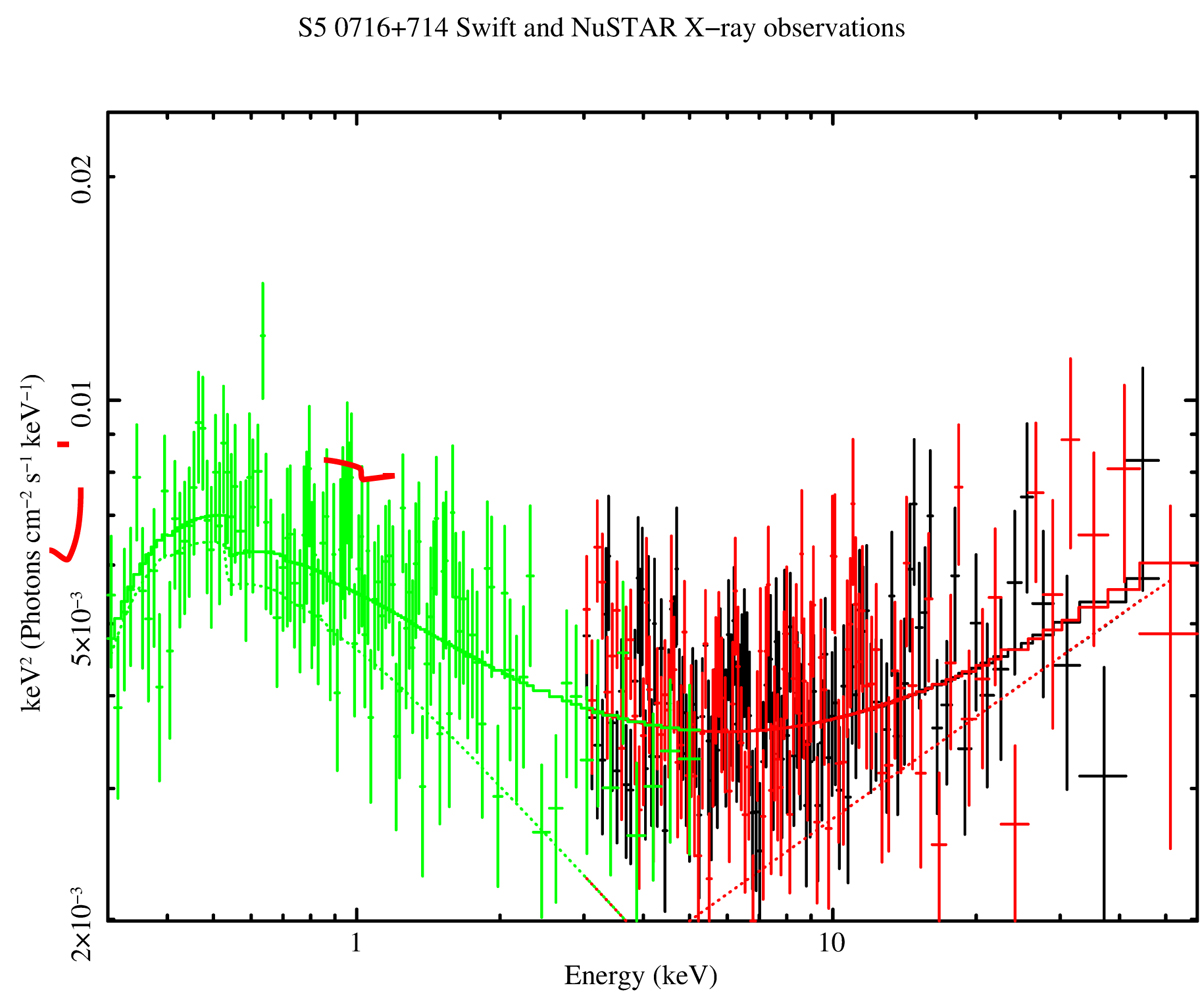
Unfolded X-ray spectrum of S50716+714 derived from simultaneous fitting of the contemporaneous Swift-XRT and NuSTAR data obtained on 24 January 2015 (MJD 57046). The adopted model is a sum of two power laws. Swift-XRT data are plotted in green, while the two NuSTAR modules are plotted in red and black, respectively. The “valley” between the two main broad-band spectral peaks is in the X-ray band.
Current usage metrics show cumulative count of Article Views (full-text article views including HTML views, PDF and ePub downloads, according to the available data) and Abstracts Views on Vision4Press platform.
Data correspond to usage on the plateform after 2015. The current usage metrics is available 48-96 hours after online publication and is updated daily on week days.
Initial download of the metrics may take a while.