Fig. 6.
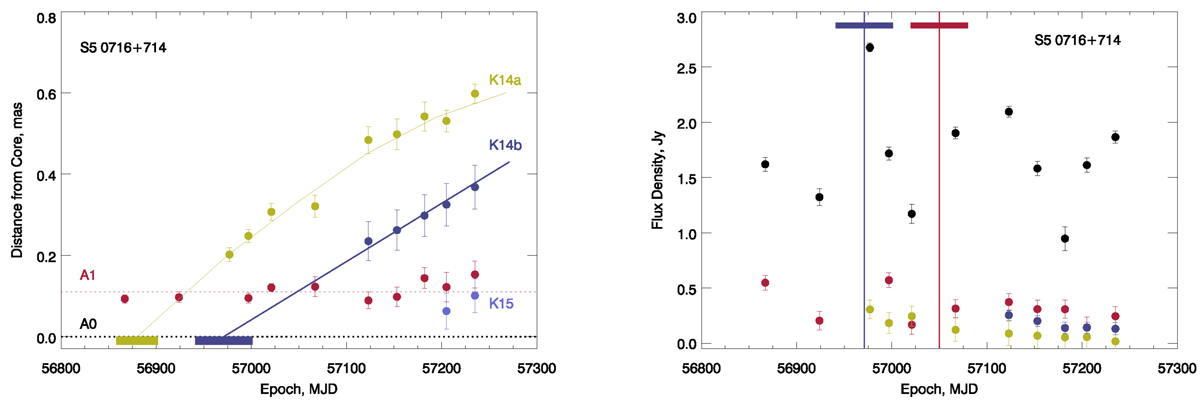
VLBA-BU-BLAZAR analysis of S5 0716+714. Left panel: separation of knots A1 (red), K14a (yellow), K14b (blue), and K15 (light blue) from the core A0 (black dotted line); the yellow and blue line segments on the position of A0 indicate the 1σ uncertainty of the ejection times of K14a and K14b, respectively. Right panel: light curves of the core A0 (black), stationary feature A1 (red), and moving knots K14a (yellow) and K14b (blue); flux densities of K14b are shifted by ∼0.1 Jy for clarity; vertical blue and red lines indicate time of passage of K14b through A0 and A1, respectively.
Current usage metrics show cumulative count of Article Views (full-text article views including HTML views, PDF and ePub downloads, according to the available data) and Abstracts Views on Vision4Press platform.
Data correspond to usage on the plateform after 2015. The current usage metrics is available 48-96 hours after online publication and is updated daily on week days.
Initial download of the metrics may take a while.