Fig. 1.
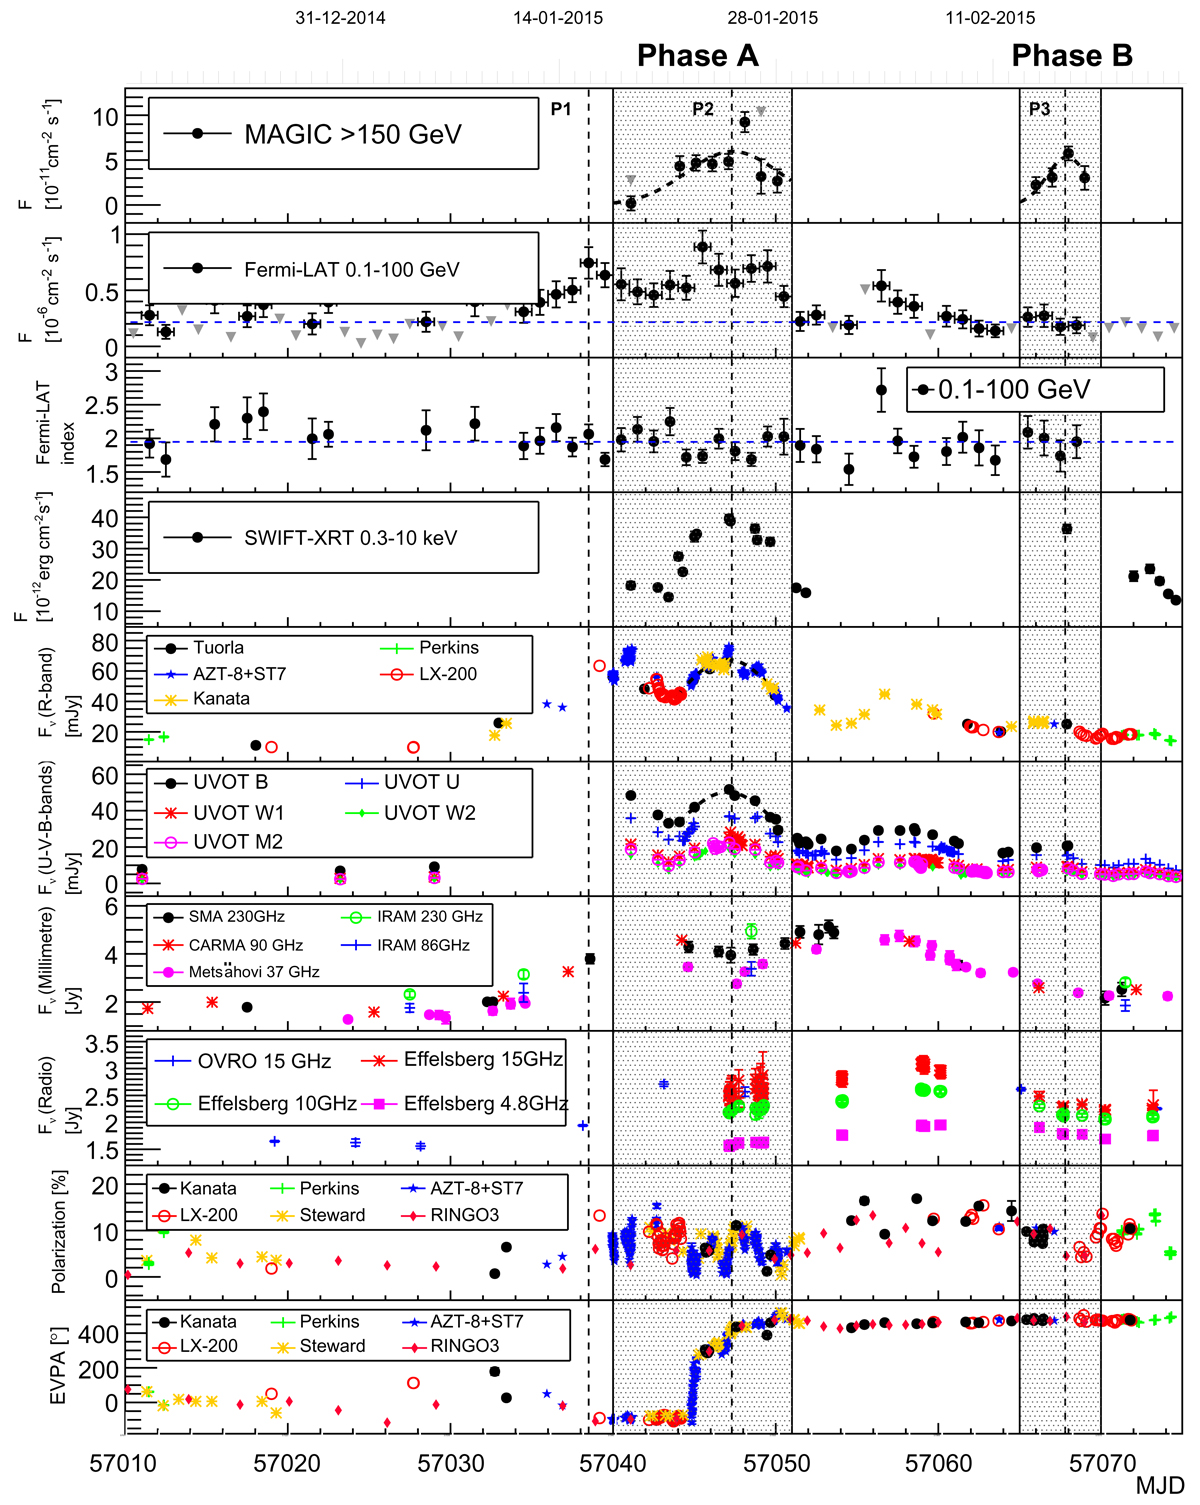
Multi-wavelength flux and index curves of S5 0716+714 during the period from MJD 57010 to MJD 57080 (19 December 2014 to 27 February 2015). The shadowed areas indicate Phase A (from 18 to 27 January 2015 – MJD 57040 to MJD 57050) and Phase B (from 12 to 17 February 2015 – MJD 57065 to MJD 57070) high states in the VHE range and the corresponding activity in the other bands. P1, P2 and P3 (vertical dashed lines) indicate peaks in the HE and VHE emission.
Current usage metrics show cumulative count of Article Views (full-text article views including HTML views, PDF and ePub downloads, according to the available data) and Abstracts Views on Vision4Press platform.
Data correspond to usage on the plateform after 2015. The current usage metrics is available 48-96 hours after online publication and is updated daily on week days.
Initial download of the metrics may take a while.