Fig. 4.
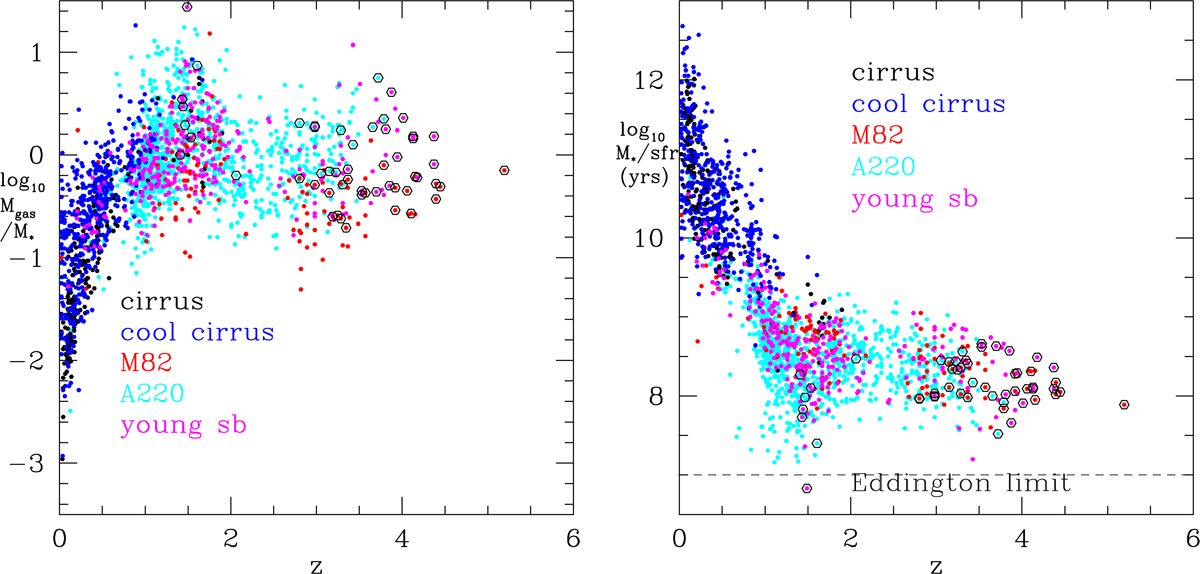
Left panel: M gas/M ⋆ vs. redshift (where M gas = 100M dust). Circled points are the “extreme” starbursts, those with SFR > 5000 M ⊙ yr−1. Right panel: M ⋆/SFR (or, the time-scale needed to make the observed mass of stars at the present star-formation rate) vs. redshift for HerMES galaxies. The source are labelled by their dominant infrared template type. The candidate extreme starbursts are shown circled.
Current usage metrics show cumulative count of Article Views (full-text article views including HTML views, PDF and ePub downloads, according to the available data) and Abstracts Views on Vision4Press platform.
Data correspond to usage on the plateform after 2015. The current usage metrics is available 48-96 hours after online publication and is updated daily on week days.
Initial download of the metrics may take a while.