Fig. 9.
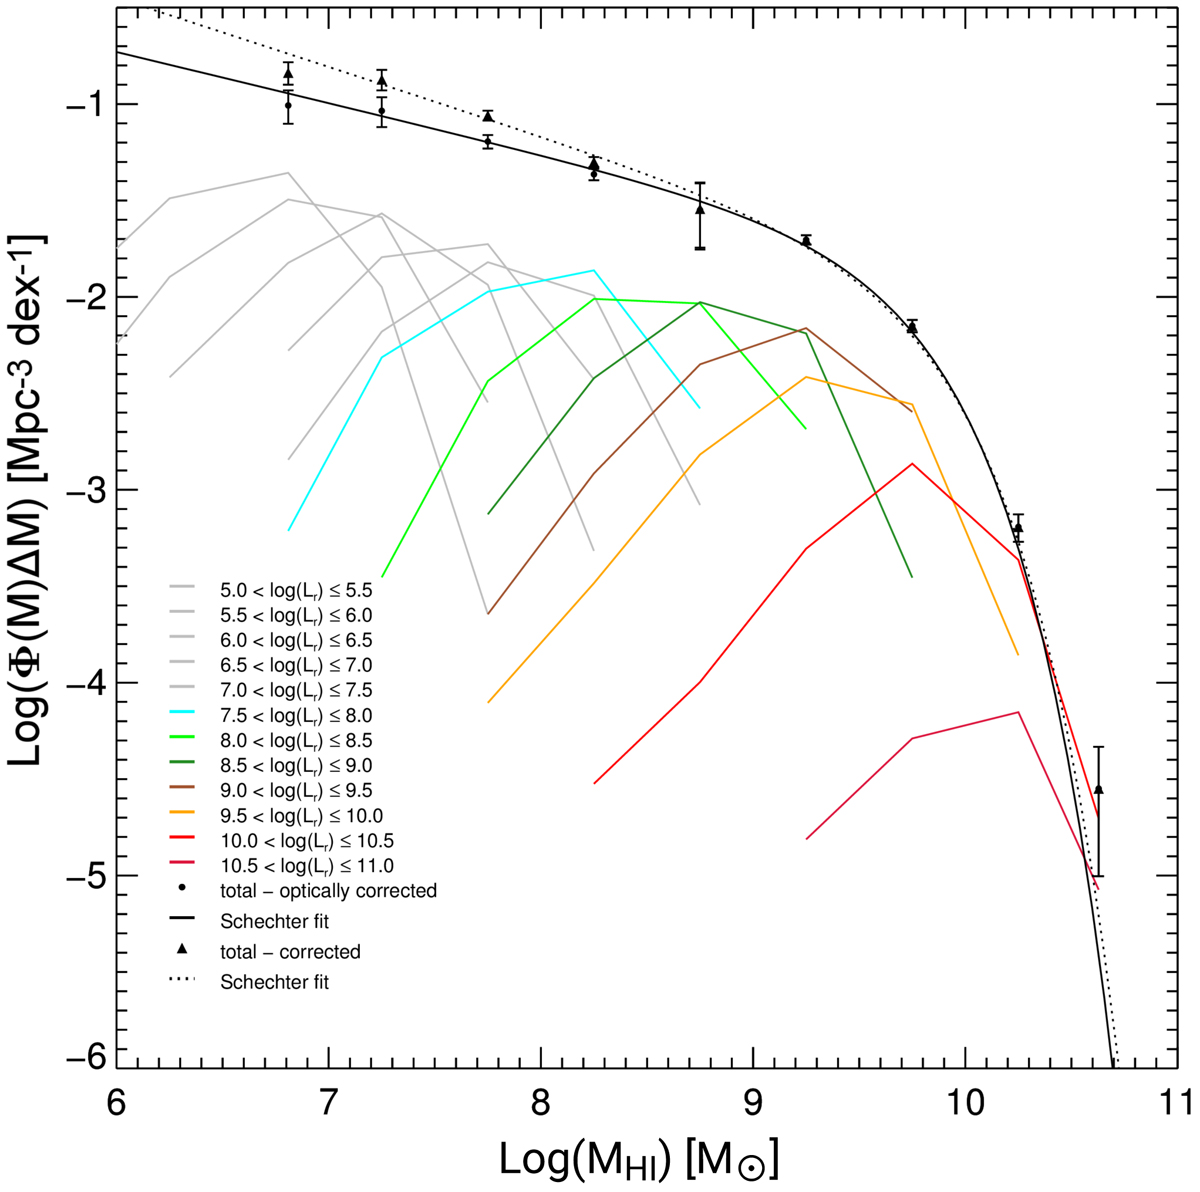
Reconstructed HIMF per luminosity bin, log(Φ(M)ΔM) in units of Mpc−3 dex−1, as a function of HI mass in each luminosity bin, shown as a set of colored and gray curves. We recreated a plot similar to Fig. 5 with artificial HI mass distributions for luminosity bins below log(Lr) = 7.75 shown in gray. We omit the uncertainty regions on each luminosity bin for viewing clarity. Uncertainties for the colored bins are the same as those in Fig. 5 and uncertainties for the gray bins are given in Table 2. Two reconstructed HIMFs are shown: the one based on the optically corrected BLF (which ignores the change in detection fraction with luminosity) is denoted by dots with a solid Schechter fit line, the other based on the corrected BLF (which takes this change into account) is denoted by triangles with a dotted Schechter fit line.
Current usage metrics show cumulative count of Article Views (full-text article views including HTML views, PDF and ePub downloads, according to the available data) and Abstracts Views on Vision4Press platform.
Data correspond to usage on the plateform after 2015. The current usage metrics is available 48-96 hours after online publication and is updated daily on week days.
Initial download of the metrics may take a while.