Fig. 8.
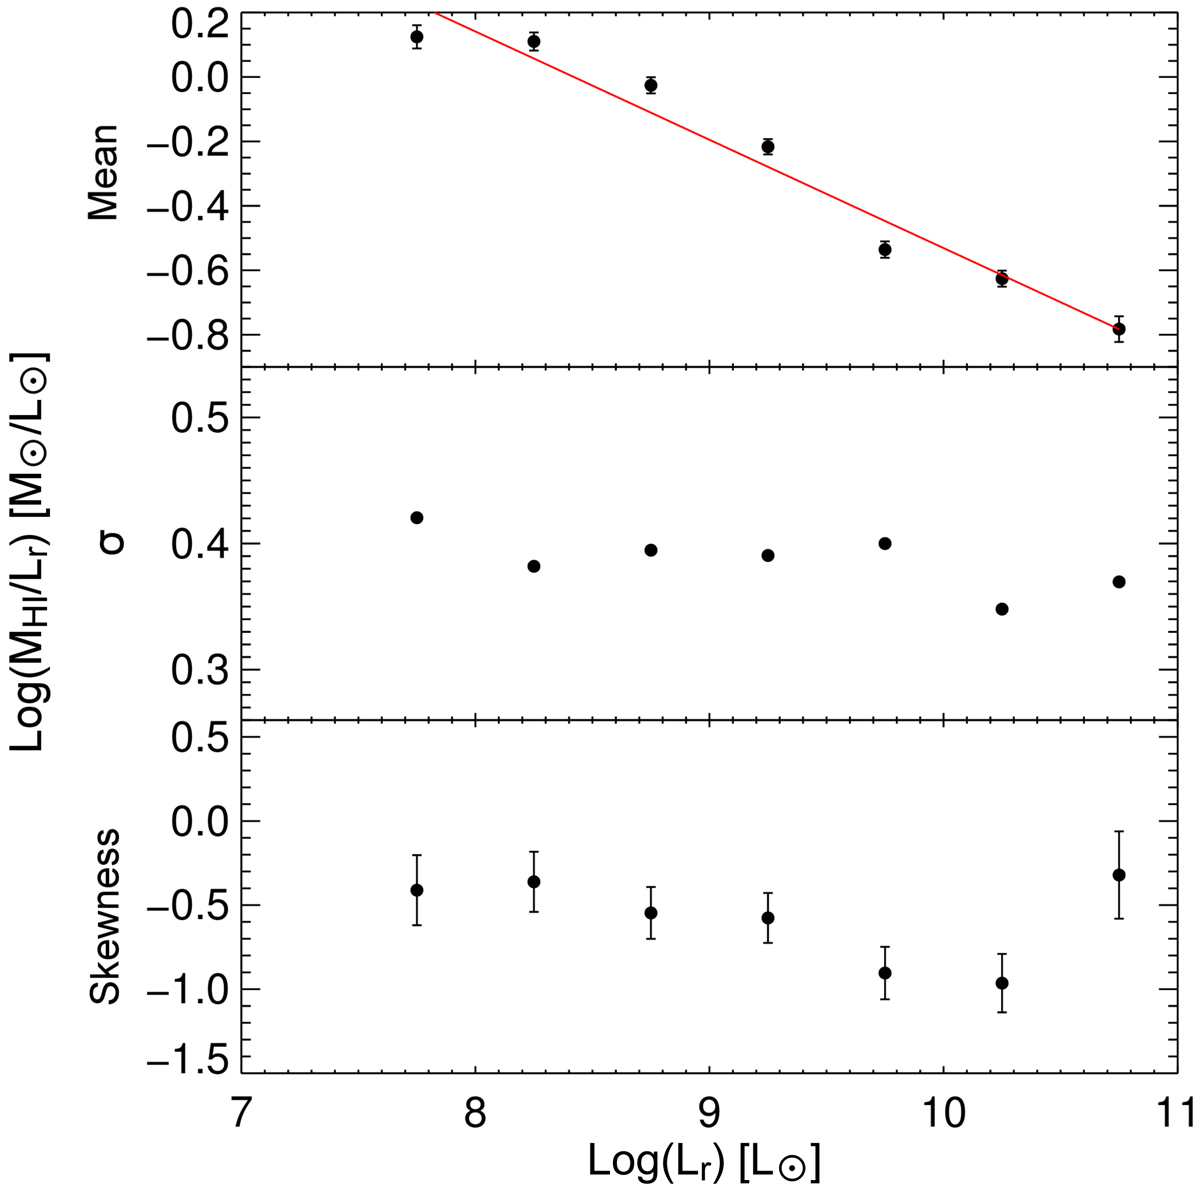
Top panel: mean log(MHI/Lr) ratio for NIBLES detections in each 0.5 dex wide luminosity bin, with uncertainties given by the standard error of the mean. The straight line indicates the least squares fit to the mean values. Middle panel: standard deviation (σ) of the log(MHI/Lr) ratio. Bottom panel: skewness of the log(MHI/Lr) ratio. All panels are a function of log(Lr) in L⊙.
Current usage metrics show cumulative count of Article Views (full-text article views including HTML views, PDF and ePub downloads, according to the available data) and Abstracts Views on Vision4Press platform.
Data correspond to usage on the plateform after 2015. The current usage metrics is available 48-96 hours after online publication and is updated daily on week days.
Initial download of the metrics may take a while.