Fig. 5.
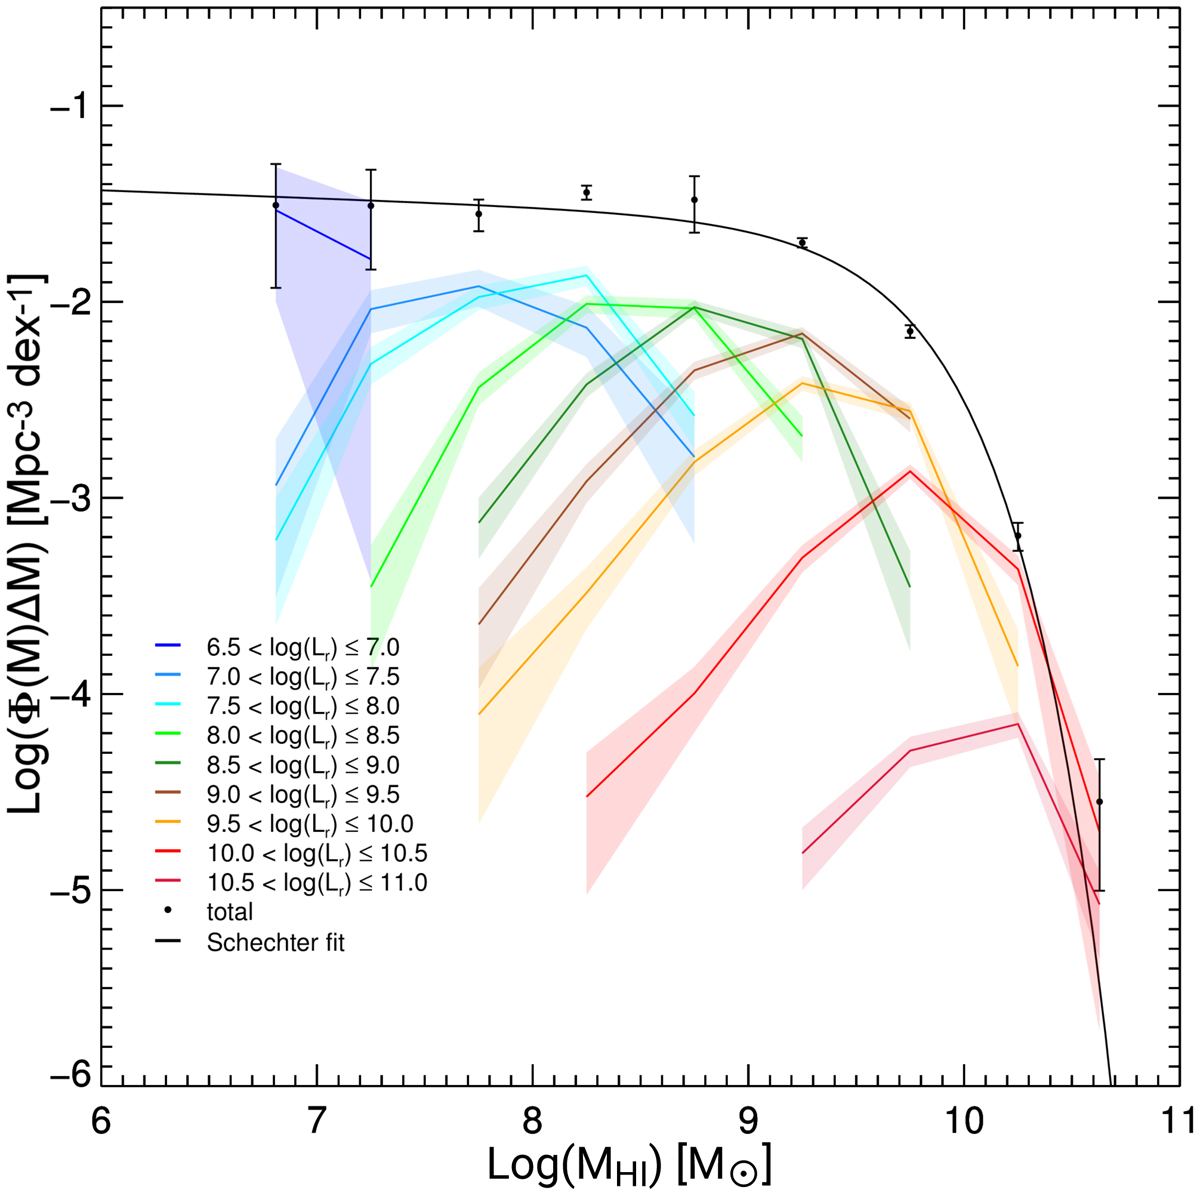
HIMF separated by luminosity: log(Φ(M)ΔM) in units of Mpc−3 dex−1 as a function of HI mass in each luminosity bin. For clarity, we only show bins containing more than one galaxy to eliminate the partially sampled bins with large uncertainties. The black points are the sum of each HI mass for the corresponding luminosity bins. Uncertainties for each luminosity bin are shown as shaded regions around each mass function, with the total quadrature sum shown as error bars on the HIMF. The black line is the Schechter fit to the HIMF.
Current usage metrics show cumulative count of Article Views (full-text article views including HTML views, PDF and ePub downloads, according to the available data) and Abstracts Views on Vision4Press platform.
Data correspond to usage on the plateform after 2015. The current usage metrics is available 48-96 hours after online publication and is updated daily on week days.
Initial download of the metrics may take a while.