Fig. 4.
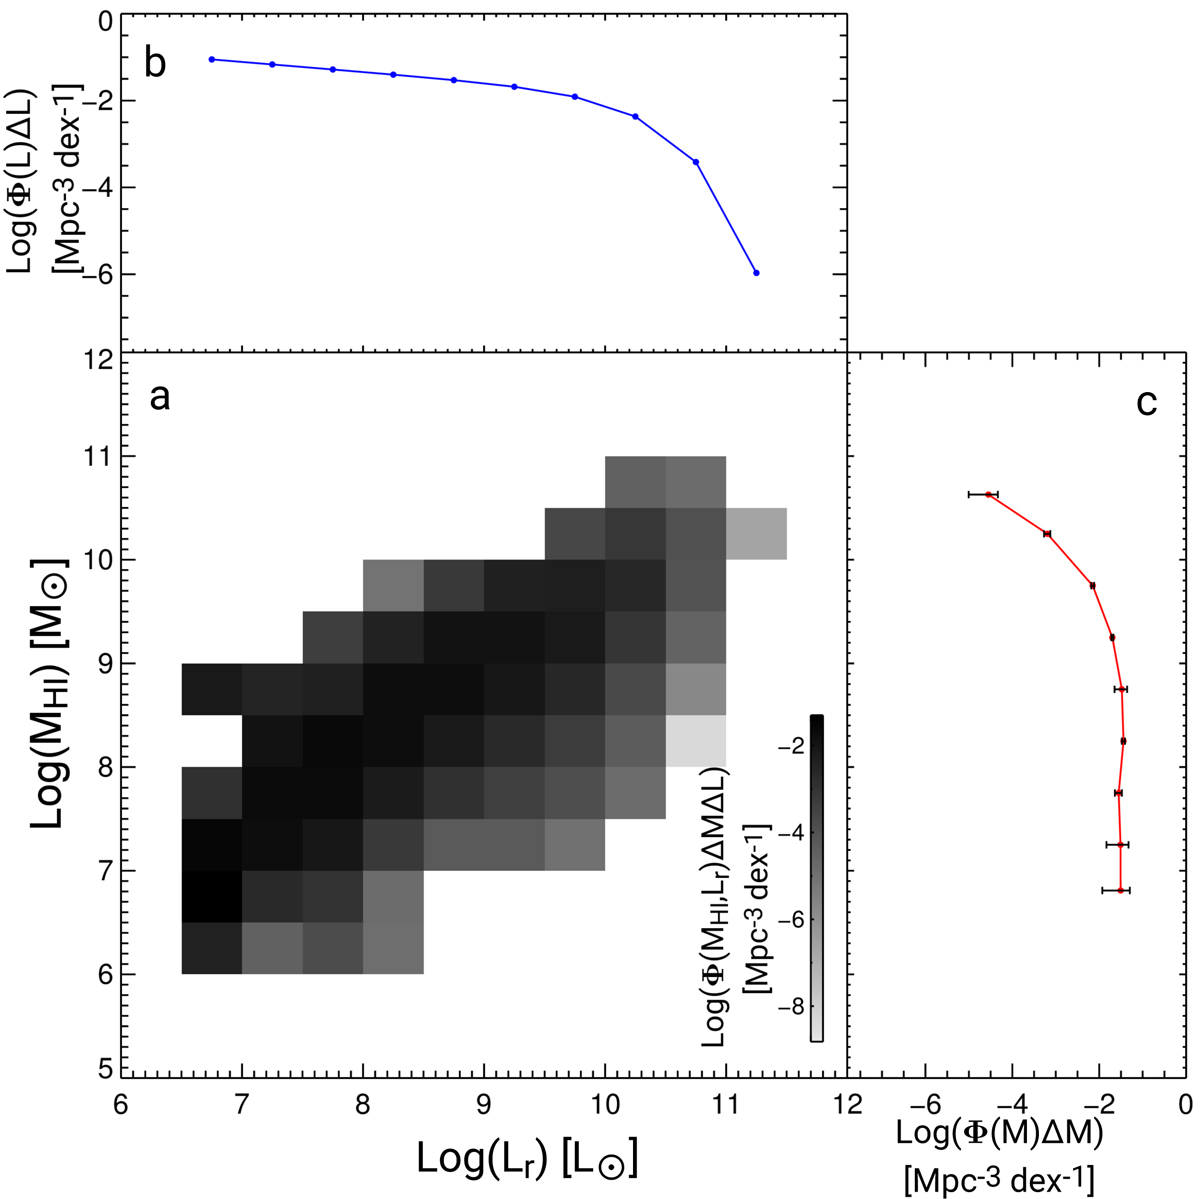
Two-dimensional bivariate HI mass–Lr distribution of the NIBLES sample, derived using only HI detections. Main panel a: log(Φ(M)ΔM) as a function of both HI mass (in M⊙) and Lr (in L⊙). Upper panel b: the summation of the main panel over HI mass, which reproduces the input M09 luminosity function, while right panel c: HIMF, the summation of the bivariate distribution over luminosity. Since the highest HI mass bin in this distribution (log(MHI) = 10.75) is not fully sampled, we plotted its position in the HIMF (panel c) at the mean value of the measured HI masses contained within the bin rather than at its normal MHI midpoint. We did not plot the point for the lowest HI mass bin (log(MHI) = 6.25) in the HIMF (panel c) since it was populated with partial occupation numbers only, due to the relatively high fractional HI mass uncertainty of these sources.
Current usage metrics show cumulative count of Article Views (full-text article views including HTML views, PDF and ePub downloads, according to the available data) and Abstracts Views on Vision4Press platform.
Data correspond to usage on the plateform after 2015. The current usage metrics is available 48-96 hours after online publication and is updated daily on week days.
Initial download of the metrics may take a while.