Free Access
Fig. 3.
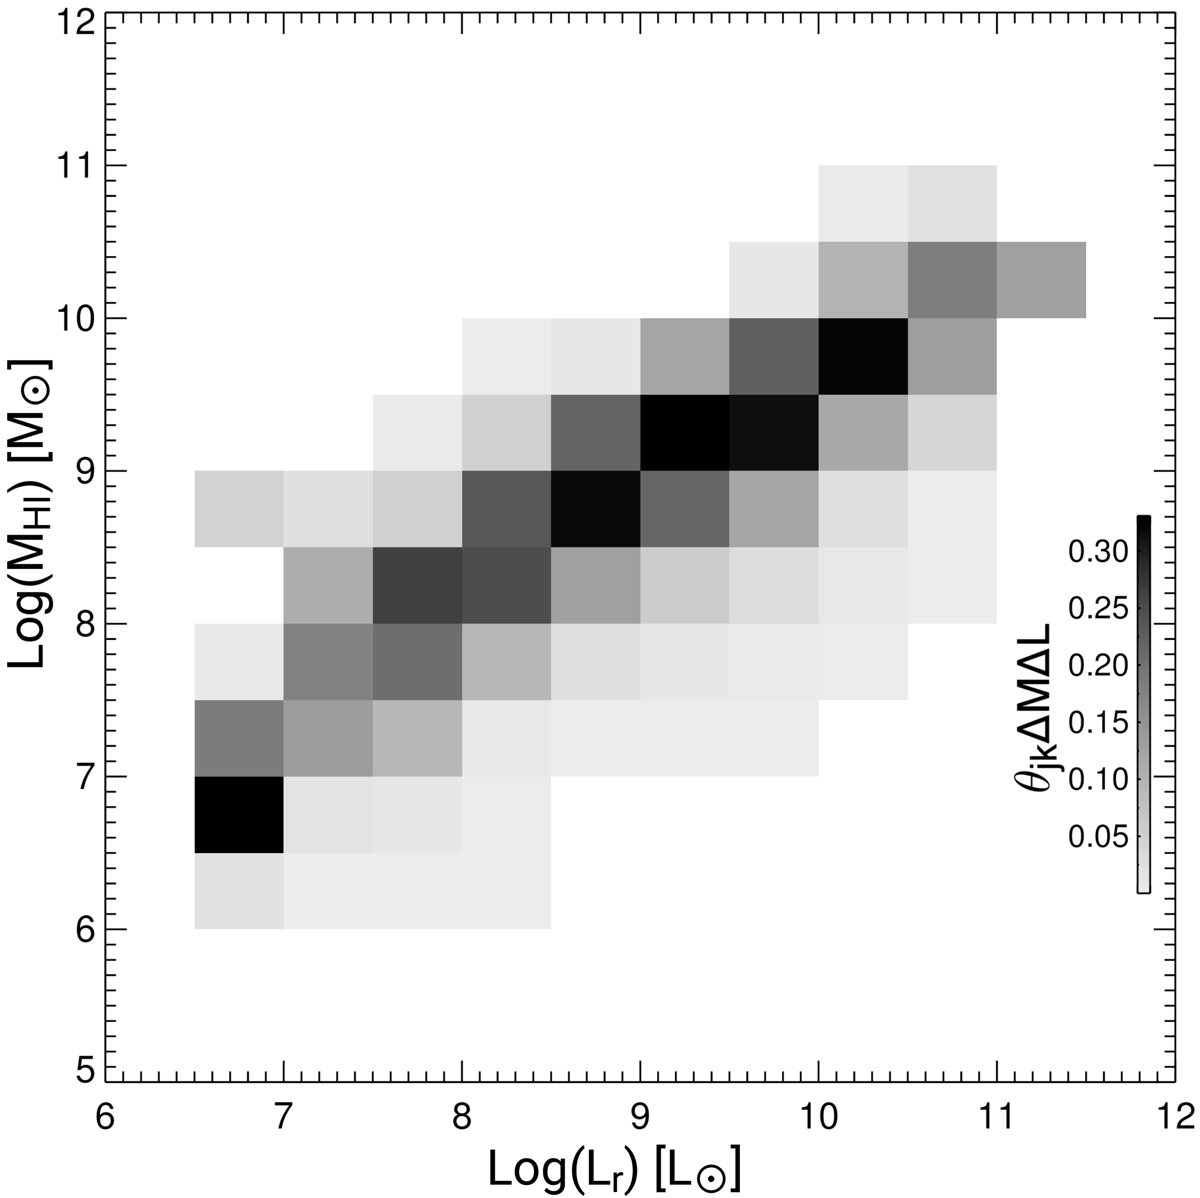
Two dimensional HI mass – r-band luminosity distribution of the NIBLES sample, derived using only HI detections. The distribution is shaded according to the fraction of galaxies that have a particular log(MHI) for a given Lr, see the legend.
Current usage metrics show cumulative count of Article Views (full-text article views including HTML views, PDF and ePub downloads, according to the available data) and Abstracts Views on Vision4Press platform.
Data correspond to usage on the plateform after 2015. The current usage metrics is available 48-96 hours after online publication and is updated daily on week days.
Initial download of the metrics may take a while.