Free Access
Fig. 2.
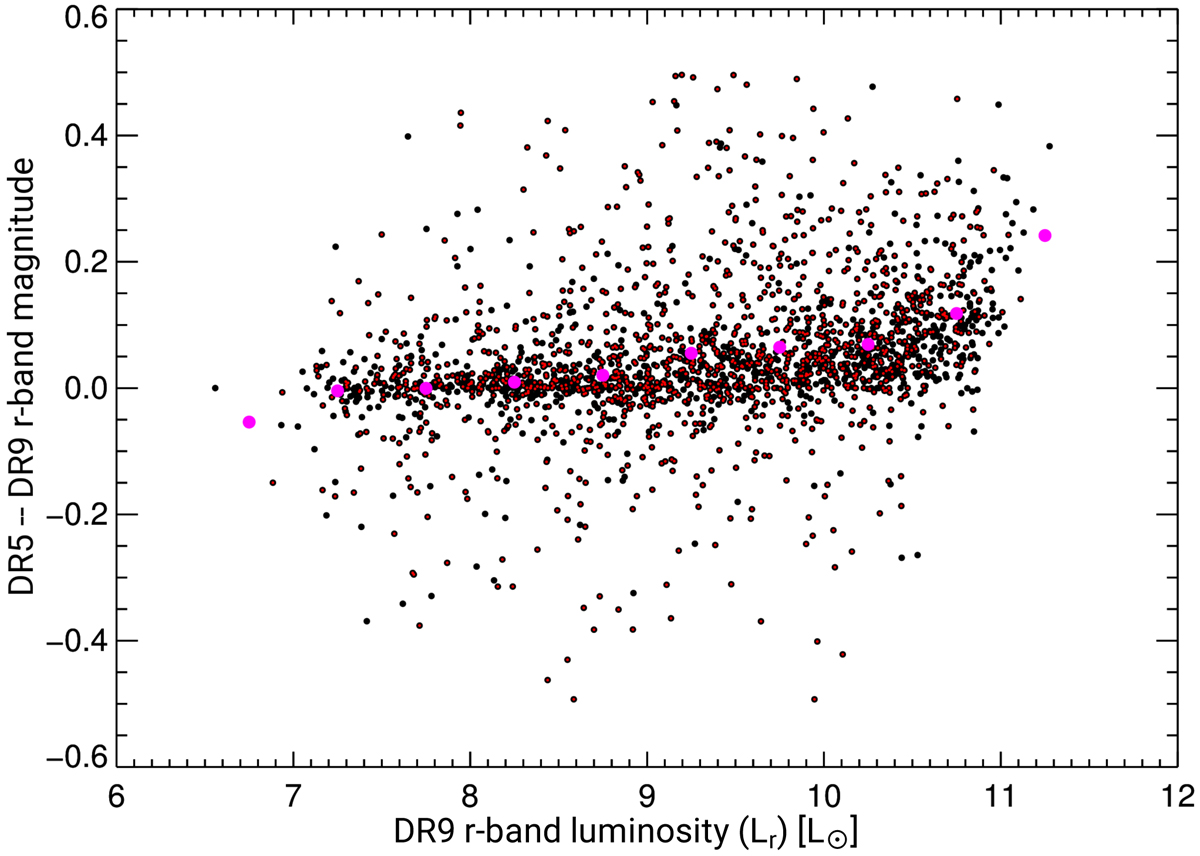
Difference between SDSS DR5 and DR9 r-band apparent Petrosian magnitude as a function of DR9 r-band luminosity for all NIBLES galaxies. Red dots indicate HI detections, black dots non-detections and magenta dots indicate the mean value of the magnitude difference in each 0.5 dex wide bin in Lr.
Current usage metrics show cumulative count of Article Views (full-text article views including HTML views, PDF and ePub downloads, according to the available data) and Abstracts Views on Vision4Press platform.
Data correspond to usage on the plateform after 2015. The current usage metrics is available 48-96 hours after online publication and is updated daily on week days.
Initial download of the metrics may take a while.