Fig. A.1.
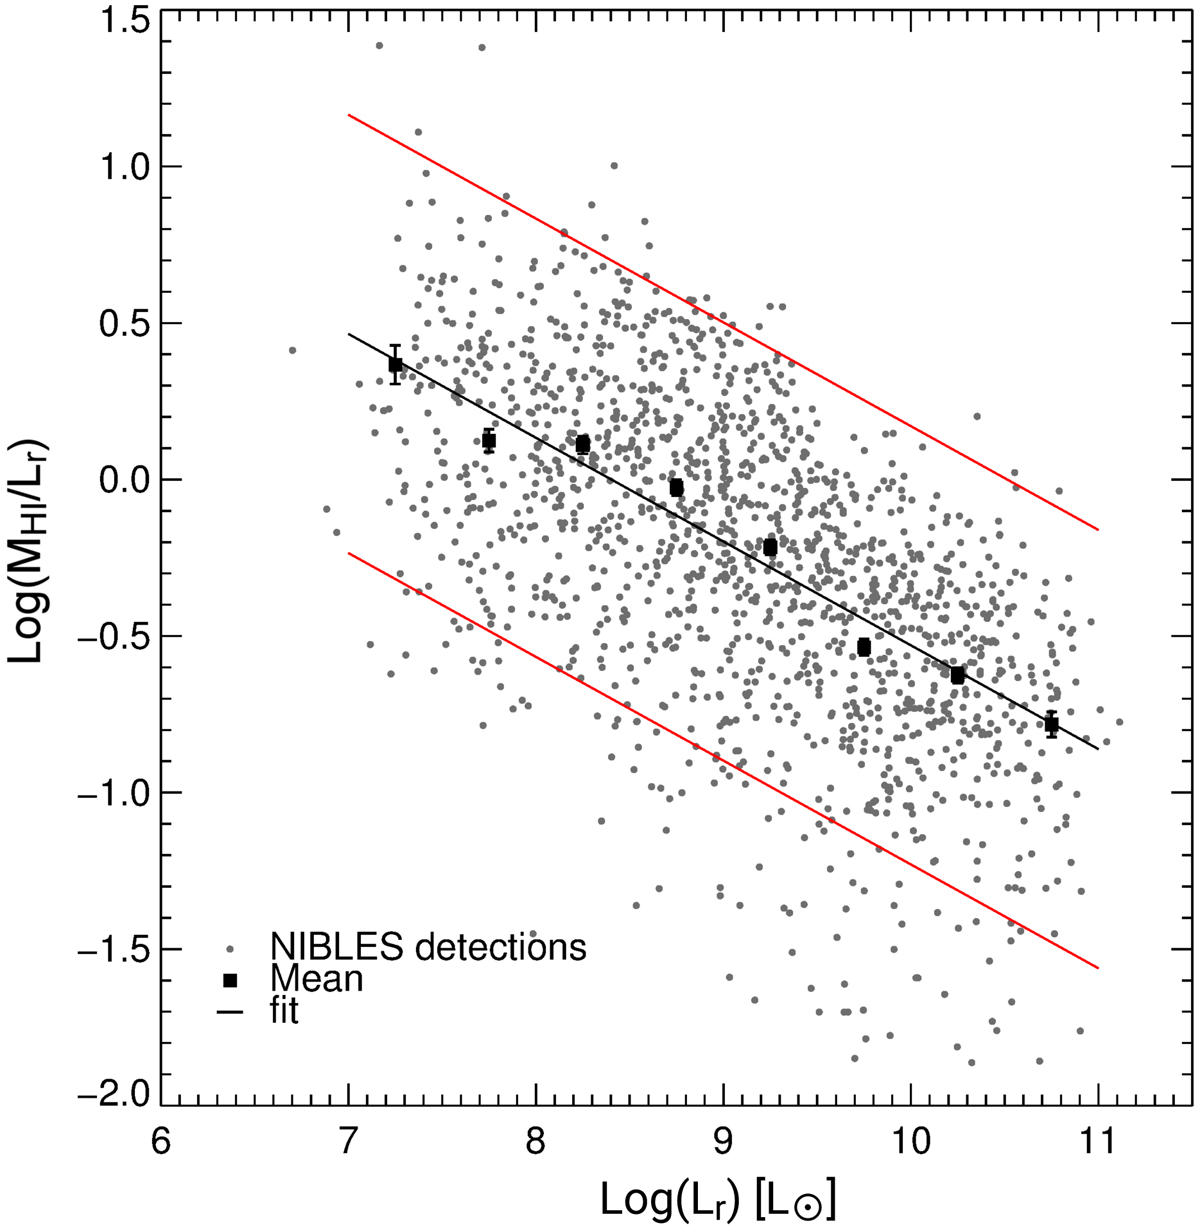
log(MHI/Lr) ratio as a function of log(Lr) for the NIBLES sample. Gray dots indicate individual sources while black squares show the mean ratio in each 0.5 dex wide log(Lr) bin. The black line is the least squares fit to the mean ratios while the red lines are the upper and lower bounds encompassing 92% of the sources, which corresponds to shifting the mean fit by ± 0.7 dex.
Current usage metrics show cumulative count of Article Views (full-text article views including HTML views, PDF and ePub downloads, according to the available data) and Abstracts Views on Vision4Press platform.
Data correspond to usage on the plateform after 2015. The current usage metrics is available 48-96 hours after online publication and is updated daily on week days.
Initial download of the metrics may take a while.