Fig. 3.
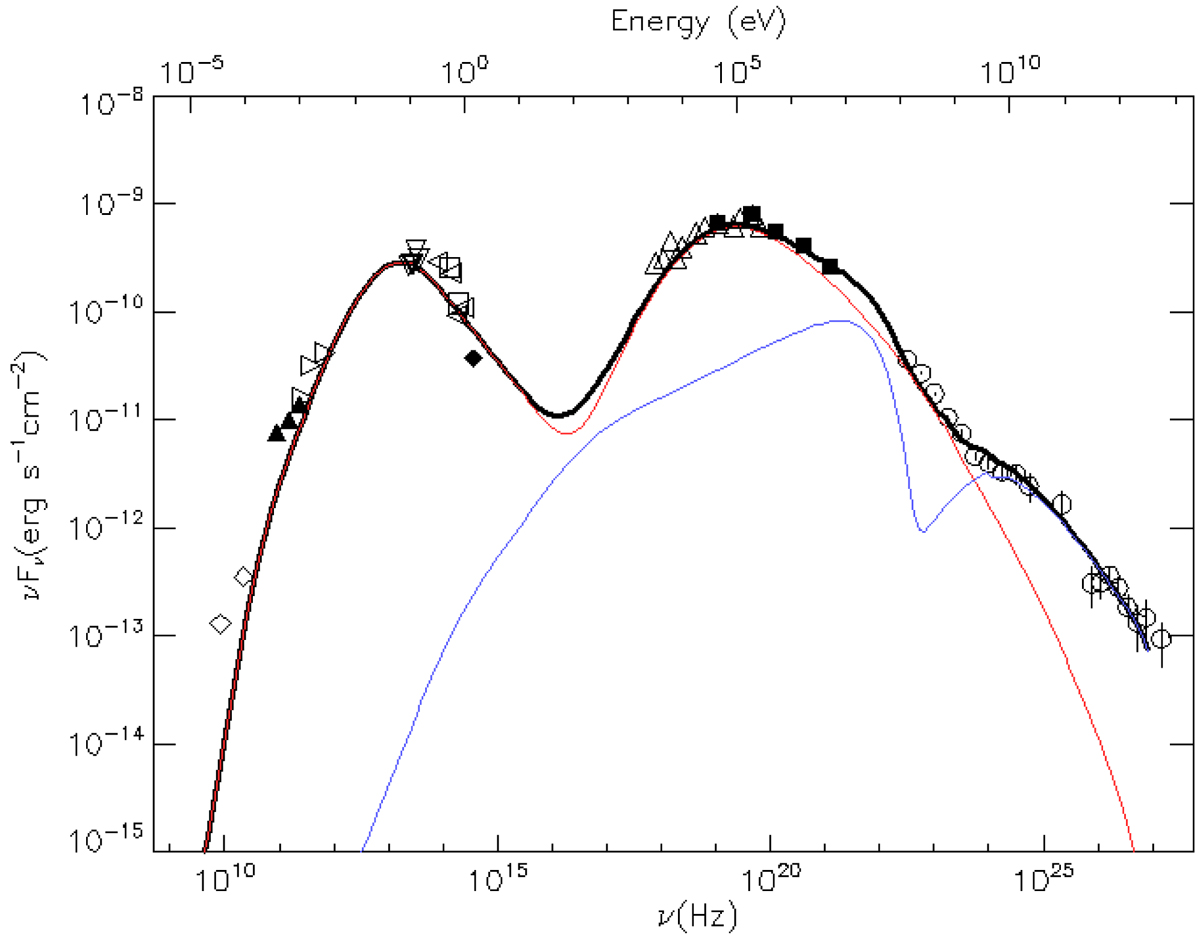
SED of Cen A core with model fits as described in text. The red curve corresponds to an SSC component designed to fit the radio to sub-GeV data. The blue curve corresponds to a second SSC component added to account for the highest energy data. The black curve corresponds to the sum of the two components. SED points as derived from H.E.S.S. and Fermi-LAT data in this paper are shown with open circles. Observations from the radio band to the MeV γ-ray band are from TANAMI (⋄), SEST (▴), JCMT (▹), MIDI (▽), NAOS/CONICA (◃), NICMOS (□), WFPC2 (♦), Suzaku(▵), OSSE/COMPTEL (▪). The acronyms are described in Appendix B.
Current usage metrics show cumulative count of Article Views (full-text article views including HTML views, PDF and ePub downloads, according to the available data) and Abstracts Views on Vision4Press platform.
Data correspond to usage on the plateform after 2015. The current usage metrics is available 48-96 hours after online publication and is updated daily on week days.
Initial download of the metrics may take a while.