Fig. 5.
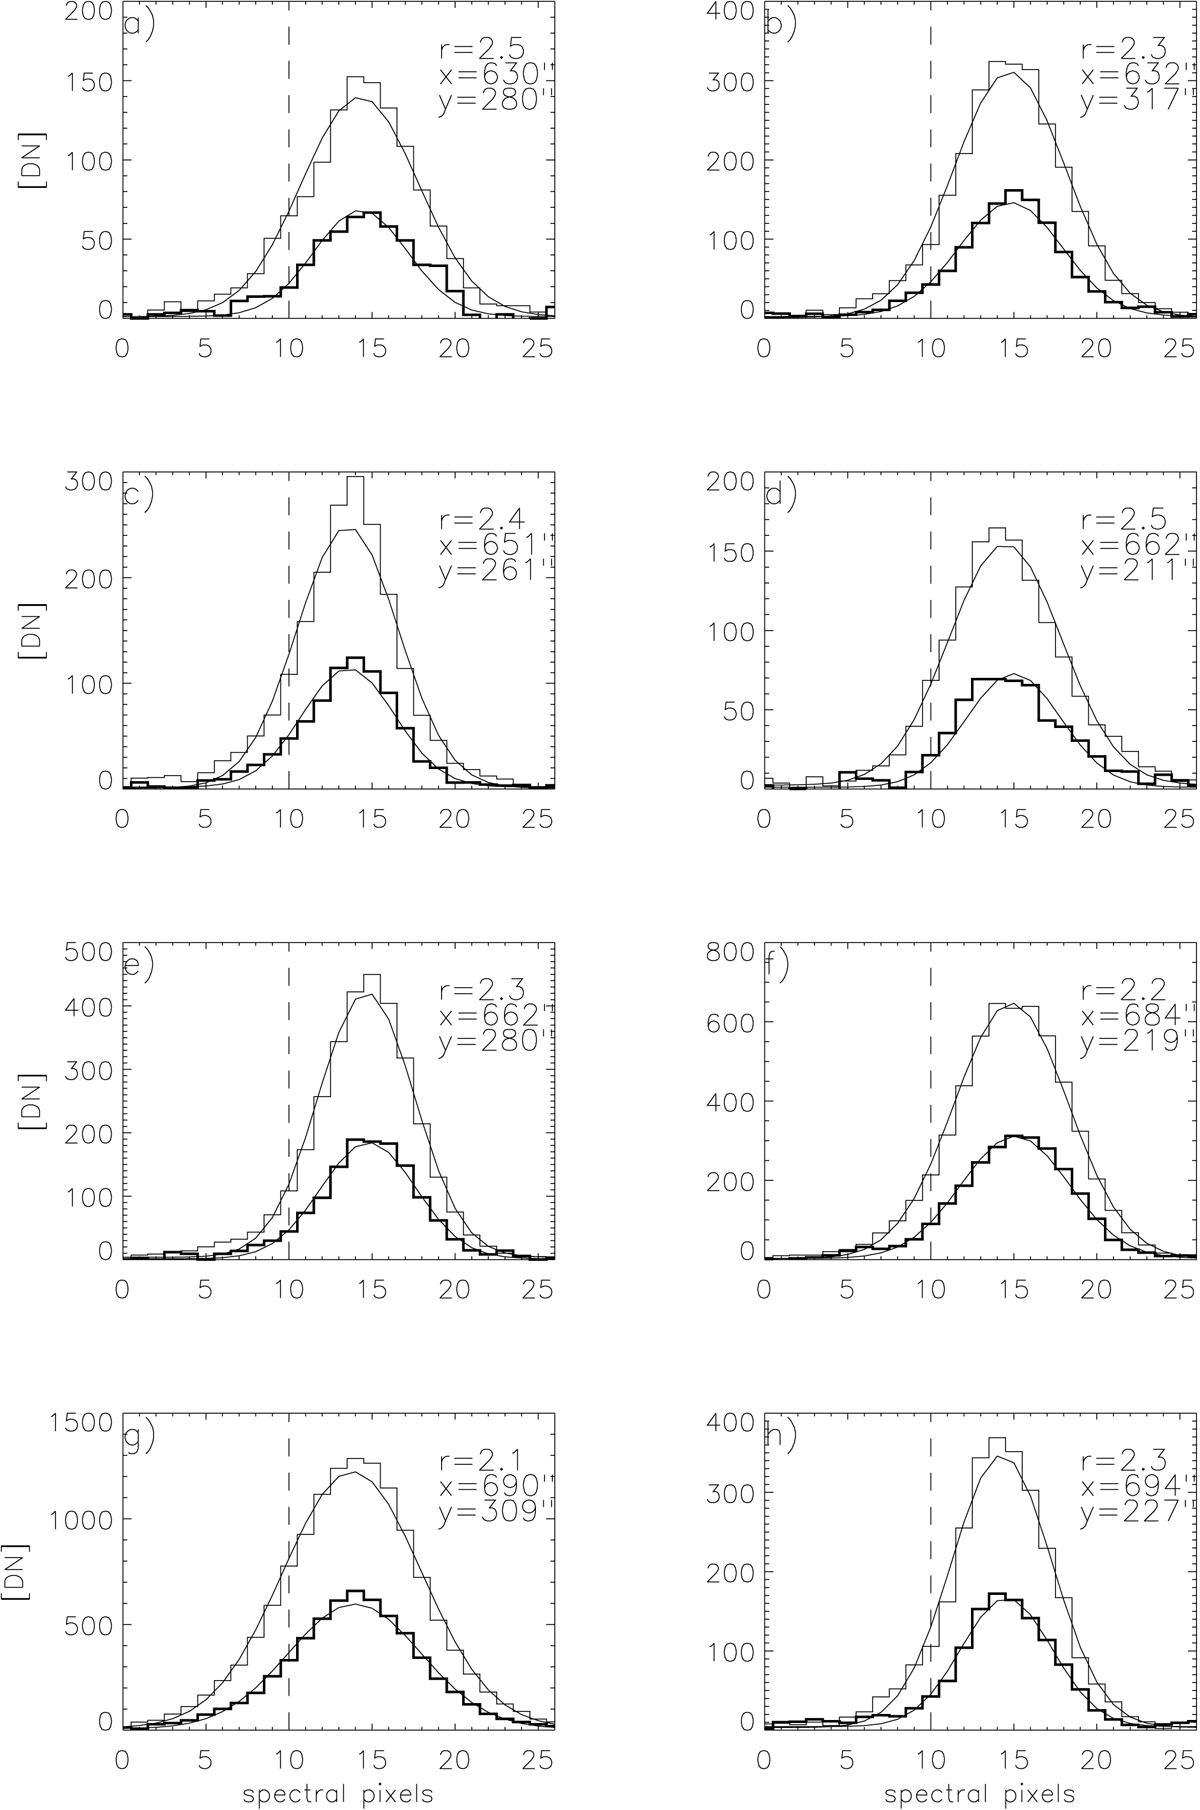
Eight selected profiles of the Si IV 1393.757 Å (thin histogram line) and 1402.772 Å (thick histogram line) spectral lines where the lines ratio (r) is higher than 2. The data are represented with a histogram line while the Gaussian fit with a continuous line. The horizontal axis is in spectral pixels and the vertical axis in Data numbers. The dashed vertical shows the rest position for both lines. In each panel we show the total intensities line ratio.
Current usage metrics show cumulative count of Article Views (full-text article views including HTML views, PDF and ePub downloads, according to the available data) and Abstracts Views on Vision4Press platform.
Data correspond to usage on the plateform after 2015. The current usage metrics is available 48-96 hours after online publication and is updated daily on week days.
Initial download of the metrics may take a while.