Fig. 4.
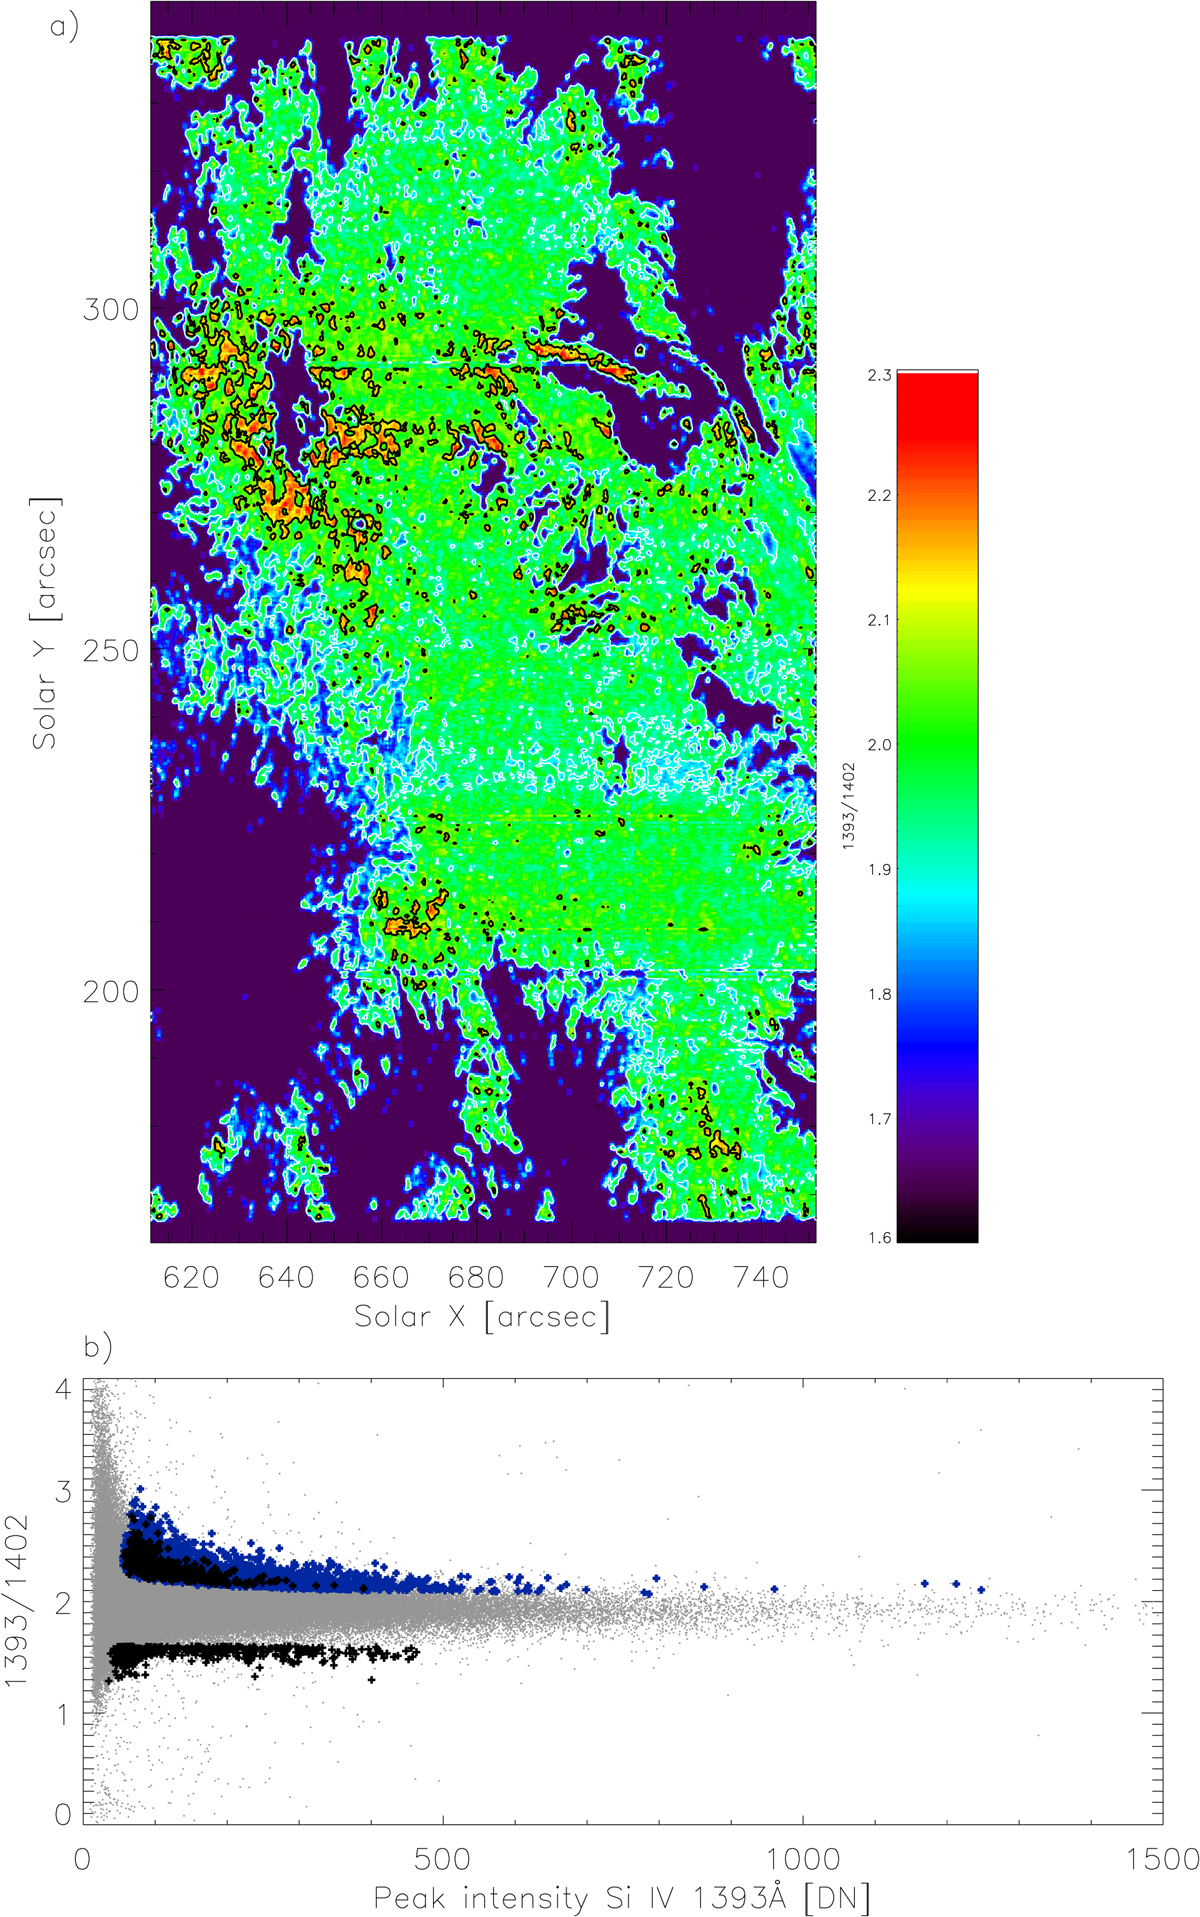
Panel a: map of I13/I12 line ratio. The colours range from 1.6 to 2.3. The map is smoothed to 3 × 3 pixels. Black areas do not have a signal because their counts are too low. The white isocontours indicate the 1.9 values and the black isocontours the 2.1 ratios. Panel b: scatter plot of line ratio as a function of I13, the Si IV 1393.757 Å intensity. The black and blue plus signs represent the selected points with line ratios higher than 2. Black plus signs also indicate selected points with line ratios lower than 1.6
Current usage metrics show cumulative count of Article Views (full-text article views including HTML views, PDF and ePub downloads, according to the available data) and Abstracts Views on Vision4Press platform.
Data correspond to usage on the plateform after 2015. The current usage metrics is available 48-96 hours after online publication and is updated daily on week days.
Initial download of the metrics may take a while.