Free Access
Fig. 2.
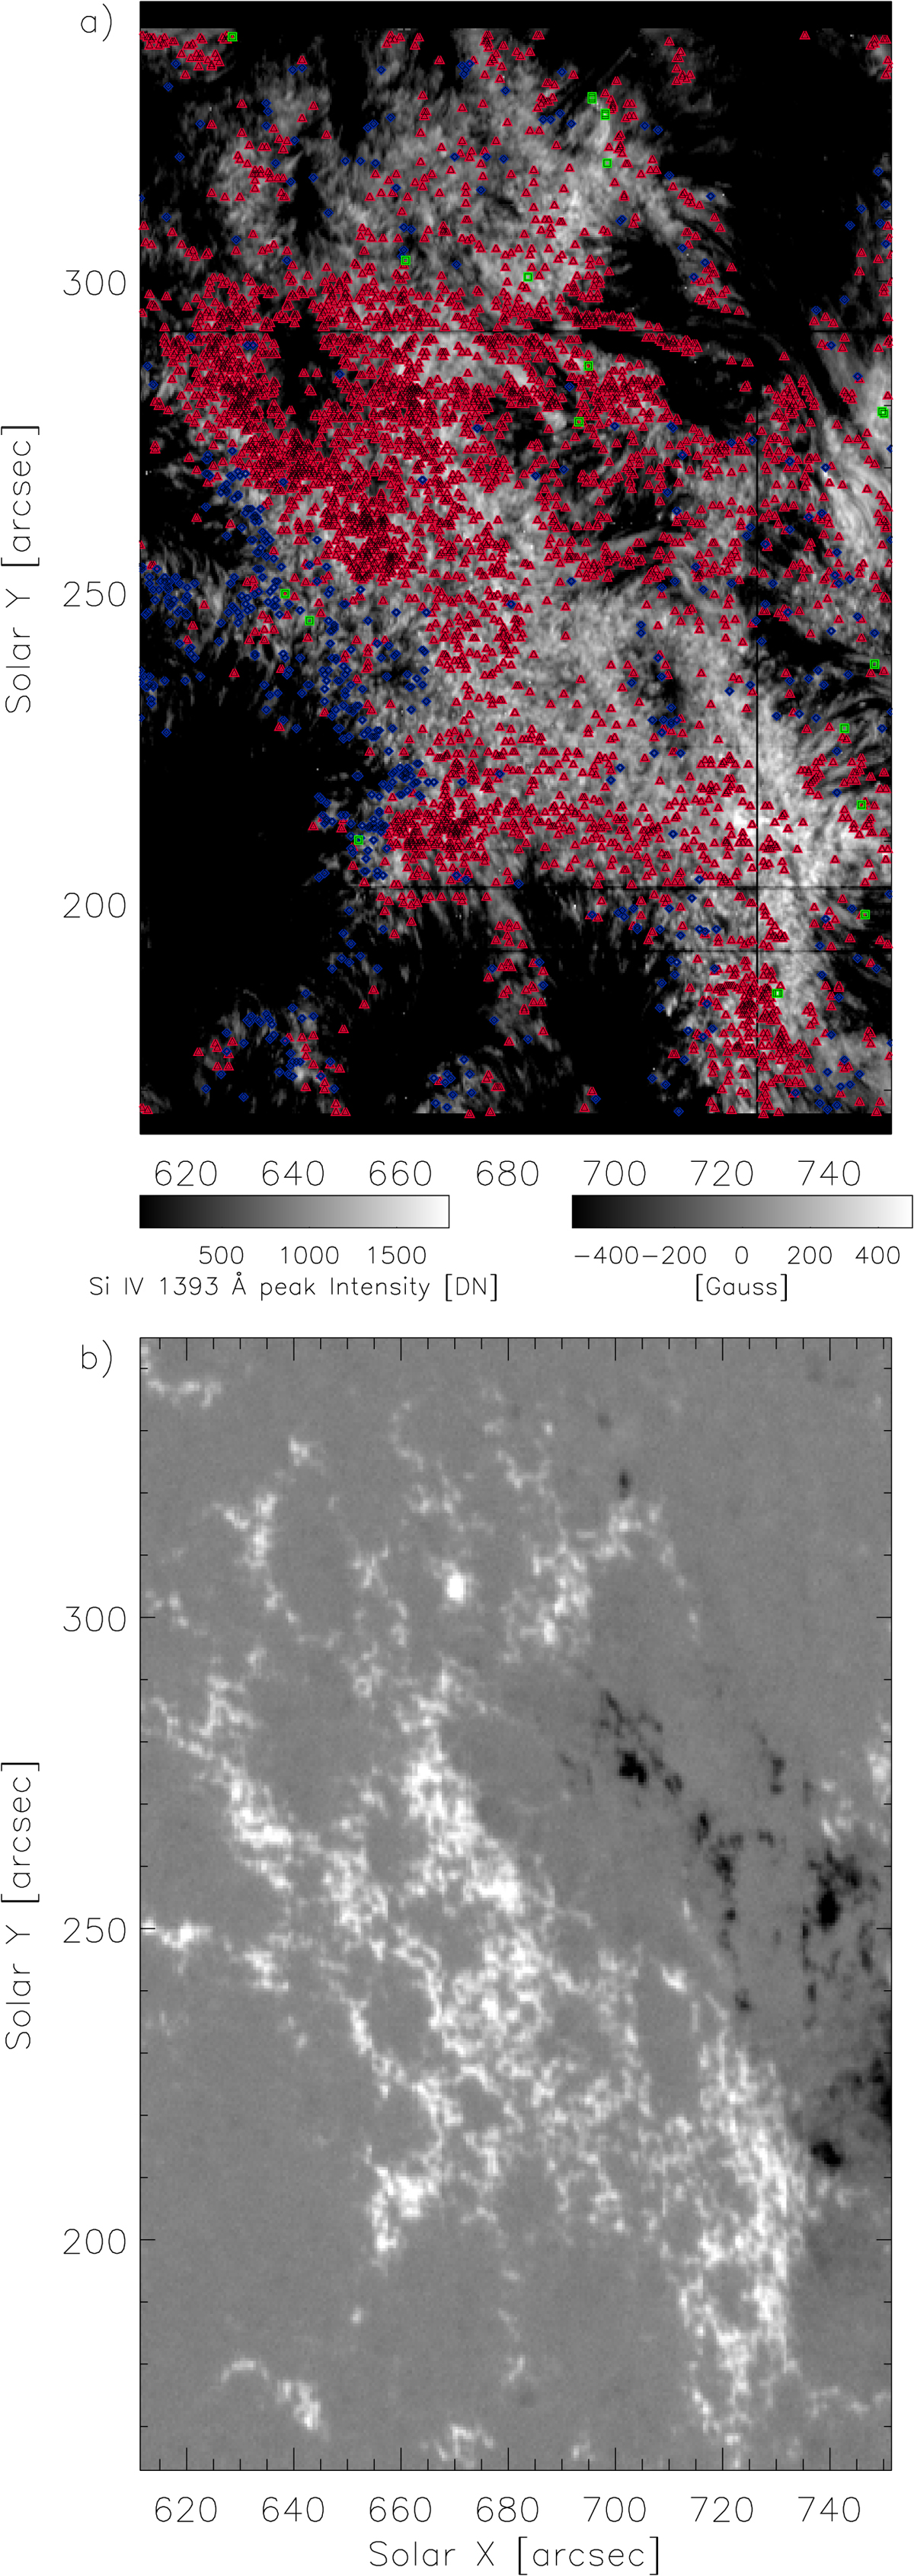
Panel a: raster intensity image of the Si IV 1393.757 Å line. High 1393/1402 ratios are indicated with red triangles, blue diamonds indicate low line ratios, and green squares indicate differentially shaped profiles. Panel b: raster-like HMI/SDO magnetogram of the same region.
Current usage metrics show cumulative count of Article Views (full-text article views including HTML views, PDF and ePub downloads, according to the available data) and Abstracts Views on Vision4Press platform.
Data correspond to usage on the plateform after 2015. The current usage metrics is available 48-96 hours after online publication and is updated daily on week days.
Initial download of the metrics may take a while.