Fig. 11.
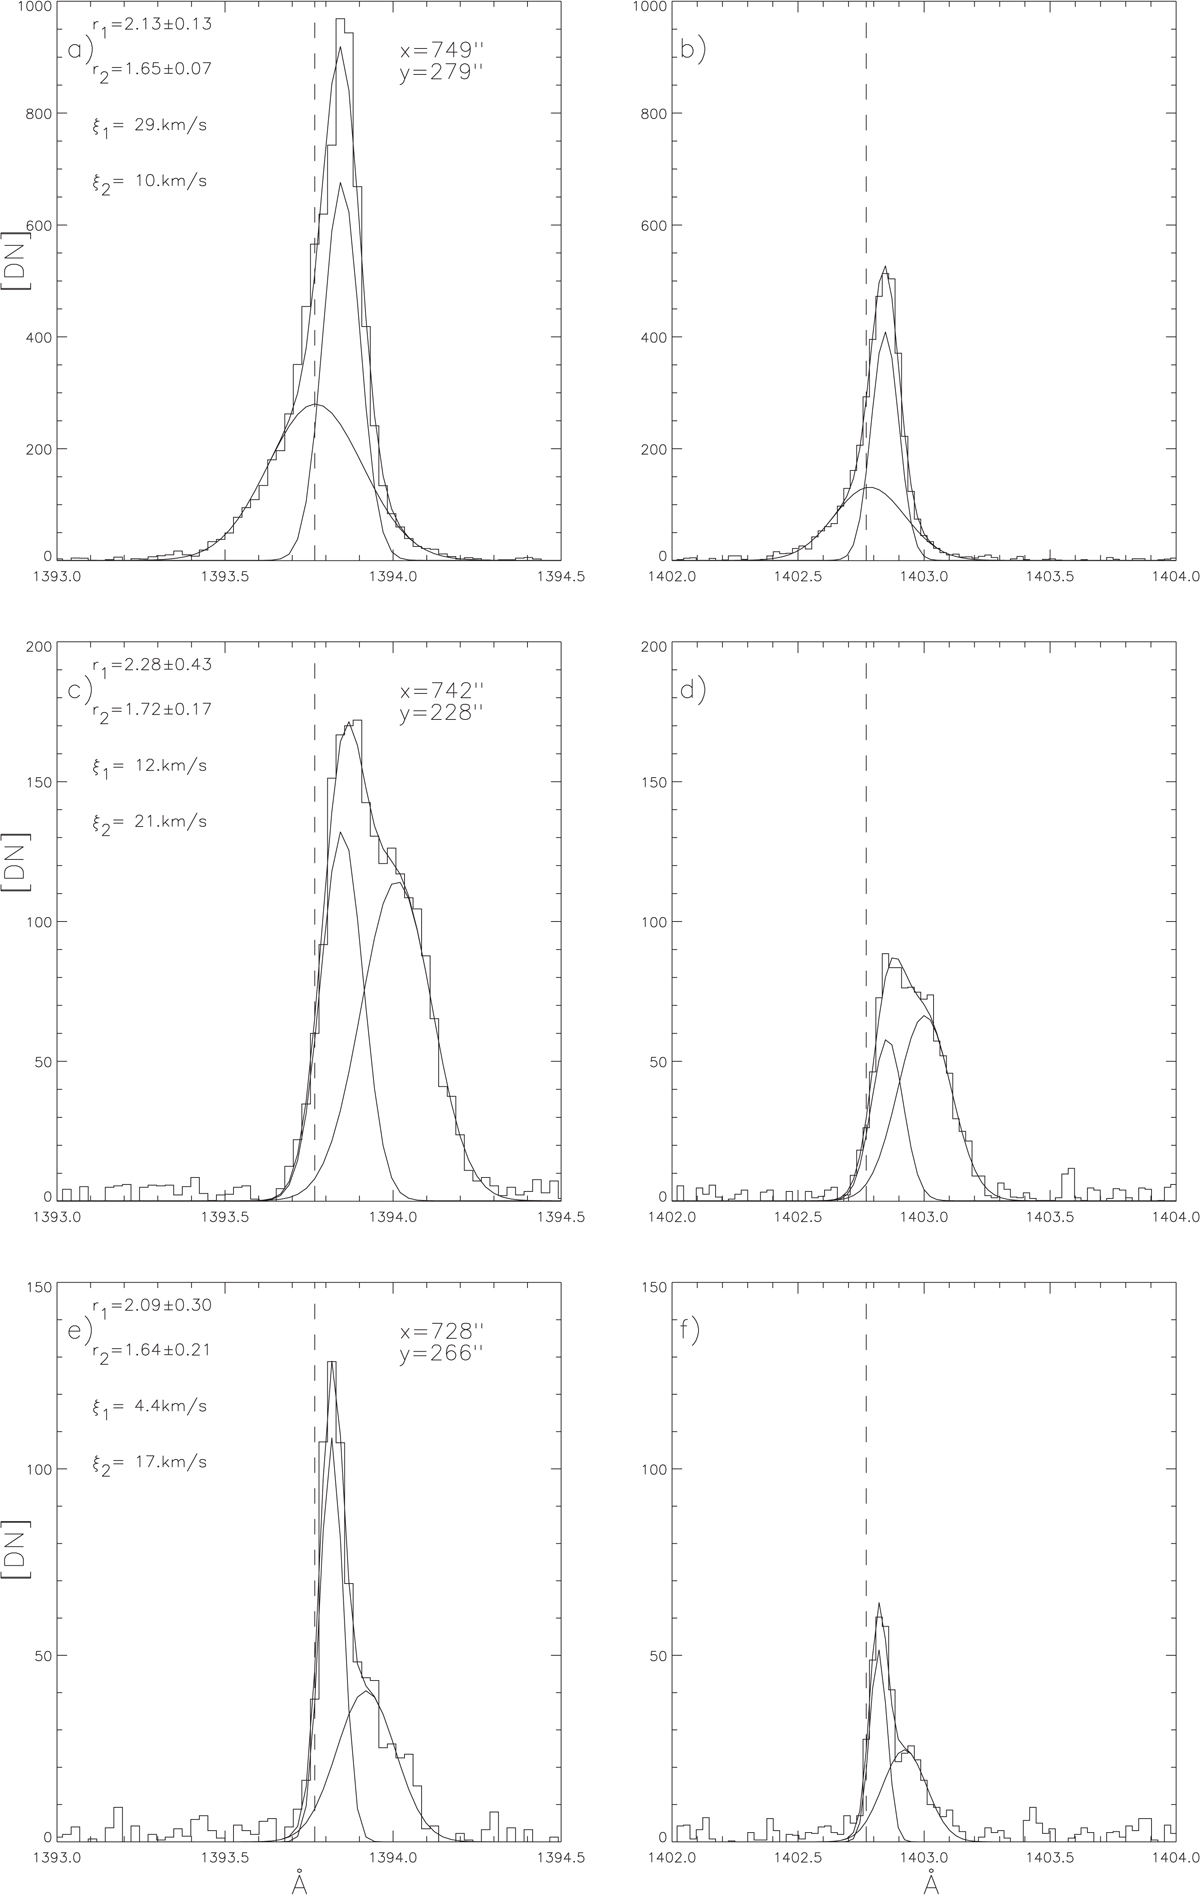
Individual spectra of Si IV 1393.757 Å and 1402.772 Å profiles with two spectral components. First column of panels: Si IV 1393.757 Å profiles; second column: Si IV 1402.772 Å profiles. The histogram line shows the data and continuous lines show the double Gaussian fit and also the two Gaussian components forming the fit of each profile. The y-axis is in counts and the x-axis in Angstroms. The vertical dashed line shows the rest position of the Si IV lines. In the first column, each panel shows the intensity ratio r1, r2, and the ξ1, ξ2 from the corresponding Gaussian components.
Current usage metrics show cumulative count of Article Views (full-text article views including HTML views, PDF and ePub downloads, according to the available data) and Abstracts Views on Vision4Press platform.
Data correspond to usage on the plateform after 2015. The current usage metrics is available 48-96 hours after online publication and is updated daily on week days.
Initial download of the metrics may take a while.