Free Access
Fig. 1.
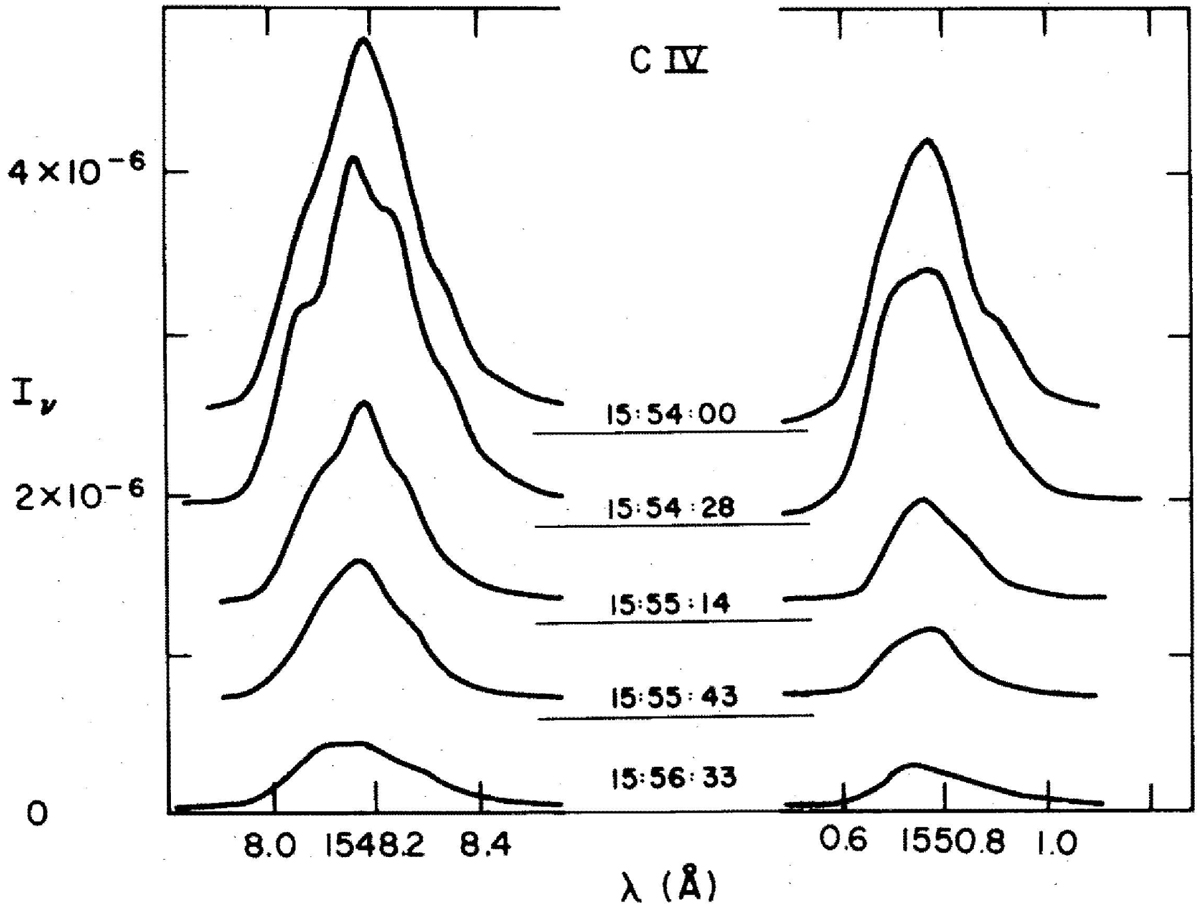
Temporal evolution of C IV 1548.189 Å and 1550.775 Å line profiles during a flare, observed in August 1973 with S082B spectrograph on Skylab, (Fig. 1c from Lites & Cook 1979, p. 599, © AAS. Reproduced with permission).
Current usage metrics show cumulative count of Article Views (full-text article views including HTML views, PDF and ePub downloads, according to the available data) and Abstracts Views on Vision4Press platform.
Data correspond to usage on the plateform after 2015. The current usage metrics is available 48-96 hours after online publication and is updated daily on week days.
Initial download of the metrics may take a while.