Fig. 8.
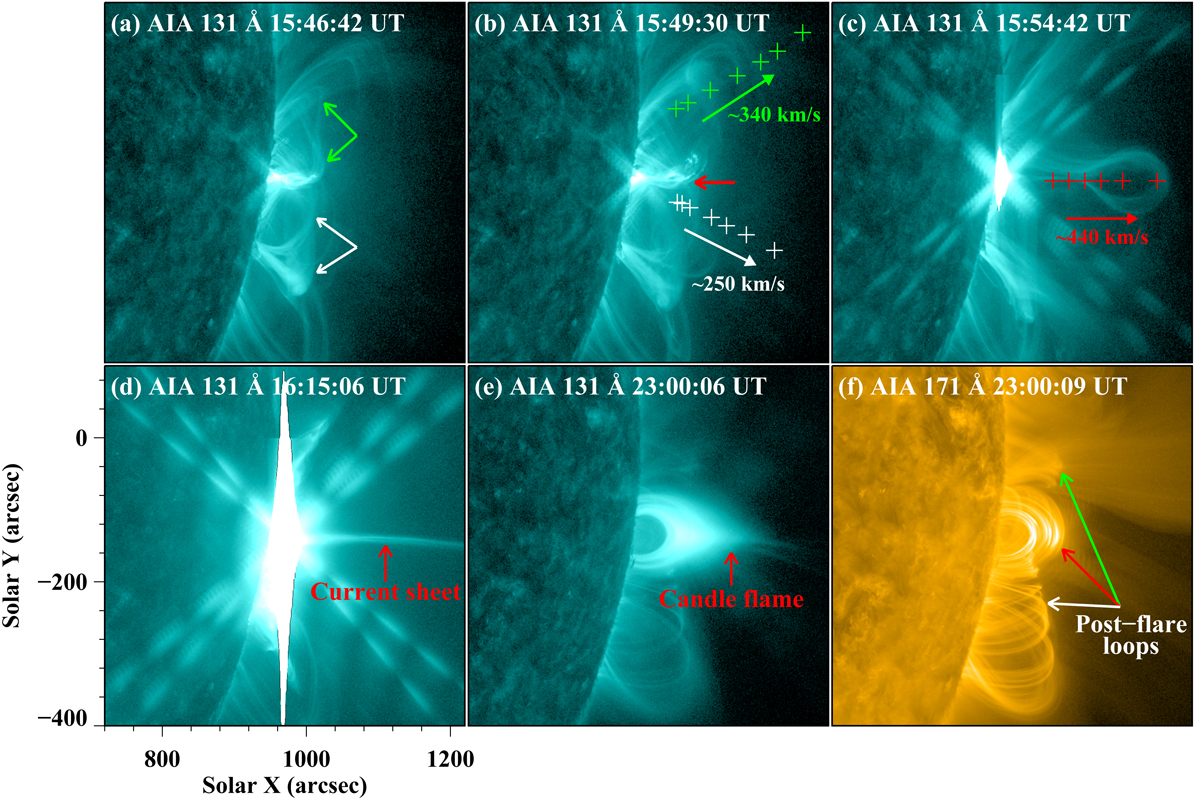
Sequence of AIA 131 Å and 171 Å images showing the evolution of another X8.2 flare in AR 12673 on 2017 September 10. Multiple ejecta components and their counterparts before eruption are denoted by the pluses and arrows with different colors. The red arrows in panels d and e mark the current sheet and candle-flame-shaped structure in the decay phase of the flare. The AIA 171 Å image in panel f displays three groups of post-flare loops with different orientations. An animation (5.mpg) of the 171 Å and the 131 Å images is available online.
Current usage metrics show cumulative count of Article Views (full-text article views including HTML views, PDF and ePub downloads, according to the available data) and Abstracts Views on Vision4Press platform.
Data correspond to usage on the plateform after 2015. The current usage metrics is available 48-96 hours after online publication and is updated daily on week days.
Initial download of the metrics may take a while.