Fig. 7.
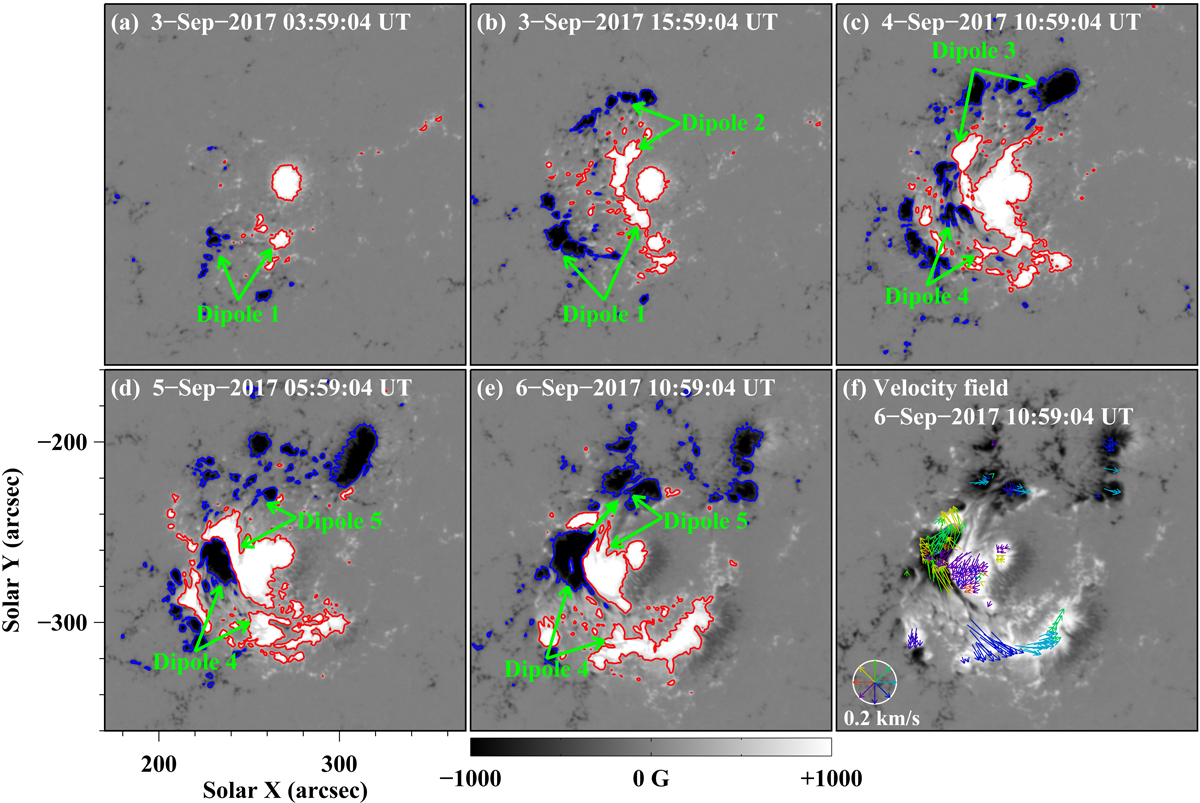
Sequence of HMI LOS magnetograms displaying the evolution of magnetic fields in AR 12673 from September 3 to September 6. The red and blue curves are contours of the LOS magnetograms at +500 and −500 G, respectively. Five newly emerging dipoles are marked by green arrows. The green solid arrow in panel e denotes the moving direction of the negative patch of “Dipole 4”. Panel f: shows the horizontal photospheric velocity field (colored arrows) derived from the HMI LOS magnetograms computed by the DAVE method. Arrows are only superimposed at locations where the absolute value of magnetic field is greater than 1000 G and illustrate the horizontal flows around 10:59:04 UT on September 6. The FOV of these panels is the same as that of Figs. 1c–d. The temporal evolution of the HMI intensitygrams and HMI LOS magnetograms is available as an online movie (4.mpg).
Current usage metrics show cumulative count of Article Views (full-text article views including HTML views, PDF and ePub downloads, according to the available data) and Abstracts Views on Vision4Press platform.
Data correspond to usage on the plateform after 2015. The current usage metrics is available 48-96 hours after online publication and is updated daily on week days.
Initial download of the metrics may take a while.