Fig. 5.
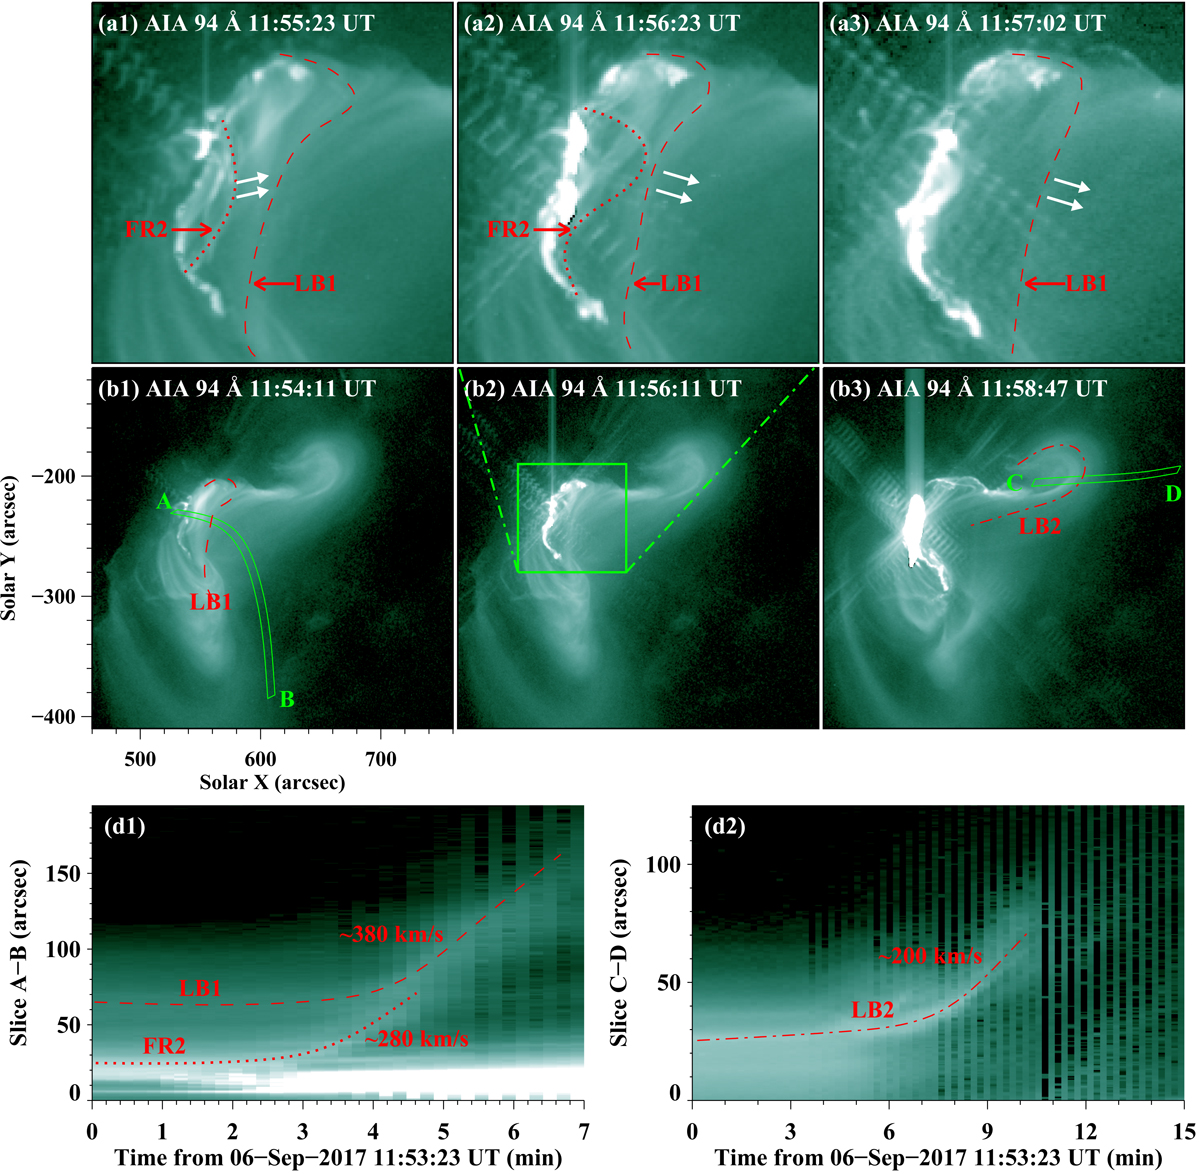
Dynamic evolutions of the complex system consisting of multiple flux ropes and twisted loop bundles during the X9.3 flare. Panels a1 –a3: sequence of AIA 94 Å images showing the interaction between FR2 and the first twisted loop bundles (LB1). The red curves delineate their main axes. The white solid arrows in panel a1 mark the rising directions of FR2. The white arrows in panels a2–a3 denote the moving direction of LB1 after the interaction with FR2. Panels b1–b3: 94 Å images with a larger FOV exhibiting LB1 and the second twisted loop bundles (LB2). The green square in panel b2 outlines the FOV of panels a1– a3. Panels d1–d2: time-space plots along arc-sector domains “A–B” of panel b1 and “C–D” of panel b3 in 94 Å channel. The red lines approximate trajectories of FR2, LB1, and LB2. The full temporal evolution of the 94 Å images is available as an online movie (3.mpg).
Current usage metrics show cumulative count of Article Views (full-text article views including HTML views, PDF and ePub downloads, according to the available data) and Abstracts Views on Vision4Press platform.
Data correspond to usage on the plateform after 2015. The current usage metrics is available 48-96 hours after online publication and is updated daily on week days.
Initial download of the metrics may take a while.