Fig. 4.
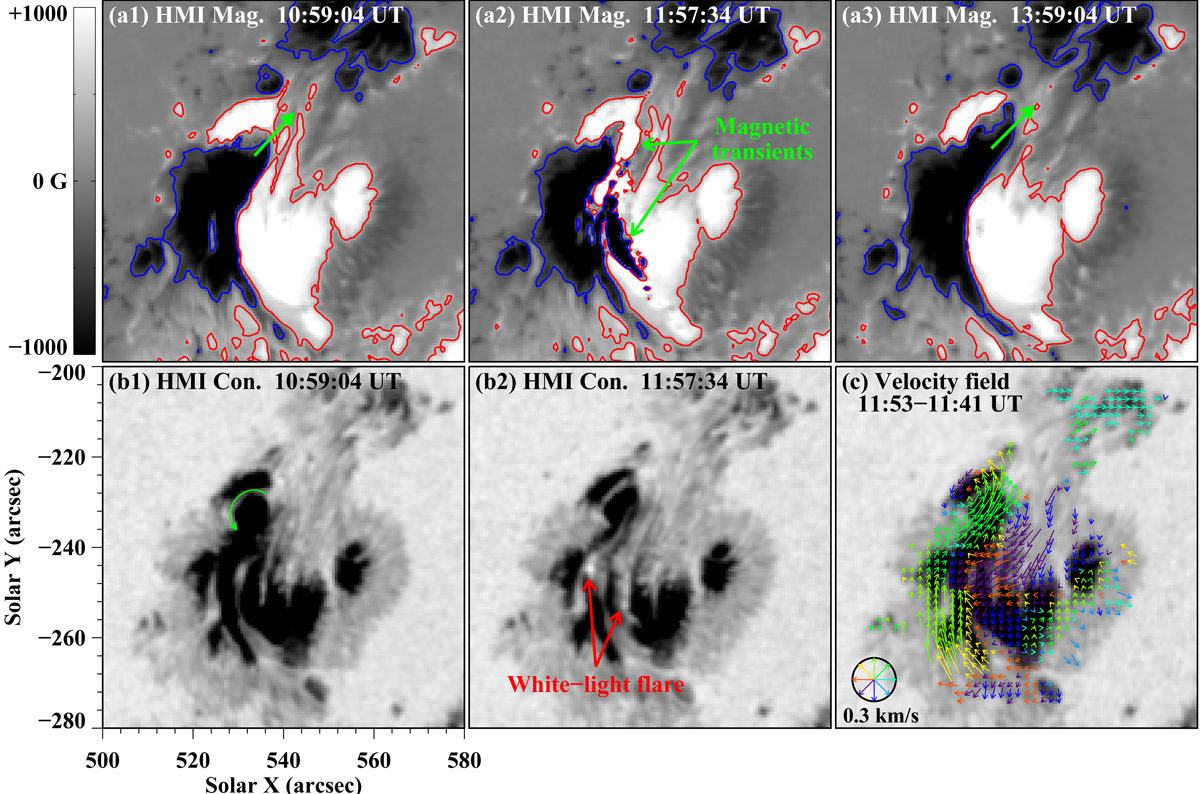
Magnetic evolution of the AR core region during the X9.3 flare. Panels a1 –a3: HMI LOS magnetograms with contours of ± 400 G displaying the magnetic fields of the core region before and after the flare peak at 12:02 UT. The green solid arrows in panels a1 and a3 denote the direction of rapid displacement of the negative patch where the north ends of the double-decker flux rope configuration are rooted. The green arrows in panel a2 mark the magnetic transients caused by the white-light flare. Panels b1–b2: corresponding HMI continuum intensitygrams. The green arrow in panel b1 labels the rotation of the negative patch. The red arrows in panel b2 mark the signals of the white-light flare. Panel c: the horizontal photospheric velocity field (colored arrows) derived from the HMI continuum intensitygrams computed by the DAVE method. In the lower-left corner, the radius of the circle corresponds to a speed of 0.3 km s−1, and the color of an arrow corresponds to its direction. The FOV is the same as Fig. 3. An animation (2.mpg) of the HMI continuum intensitygrams and LOS magnetograms is available online.
Current usage metrics show cumulative count of Article Views (full-text article views including HTML views, PDF and ePub downloads, according to the available data) and Abstracts Views on Vision4Press platform.
Data correspond to usage on the plateform after 2015. The current usage metrics is available 48-96 hours after online publication and is updated daily on week days.
Initial download of the metrics may take a while.