Fig. 1.
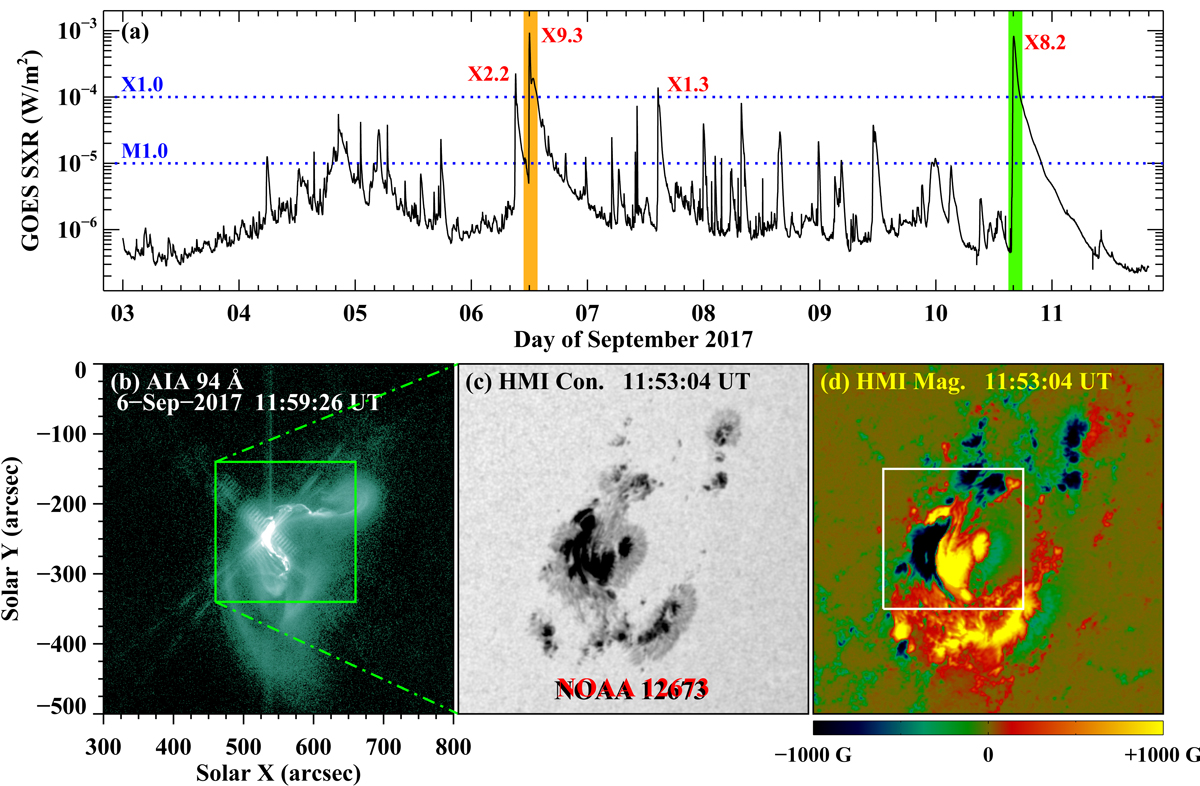
Flares produced by AR 12673. Panel a: GOES SXR 1–8 Å flux variation from 2017 September 3 to September 11. Four X-class flares took place during this period, of which the two largest ones reached up to X9.3 (orange region) and X8.2 (green region), respectively. The blue horizontal dotted lines mark the threshold levels of M1.0 and X1.0 flares. Panels b–d: overview of the X9.3 flare in AR 12673 on September 6. The AIA 94 Å image in panel b shows this AR at the onset of the flare. HMI continuum intensitygram and LOS magnetogram in panels c and d display the sunspots and underlying magnetic fields in the AR core region, whose field of view (FOV) is outlined by the green square in panel b.
Current usage metrics show cumulative count of Article Views (full-text article views including HTML views, PDF and ePub downloads, according to the available data) and Abstracts Views on Vision4Press platform.
Data correspond to usage on the plateform after 2015. The current usage metrics is available 48-96 hours after online publication and is updated daily on week days.
Initial download of the metrics may take a while.