Fig. 6.
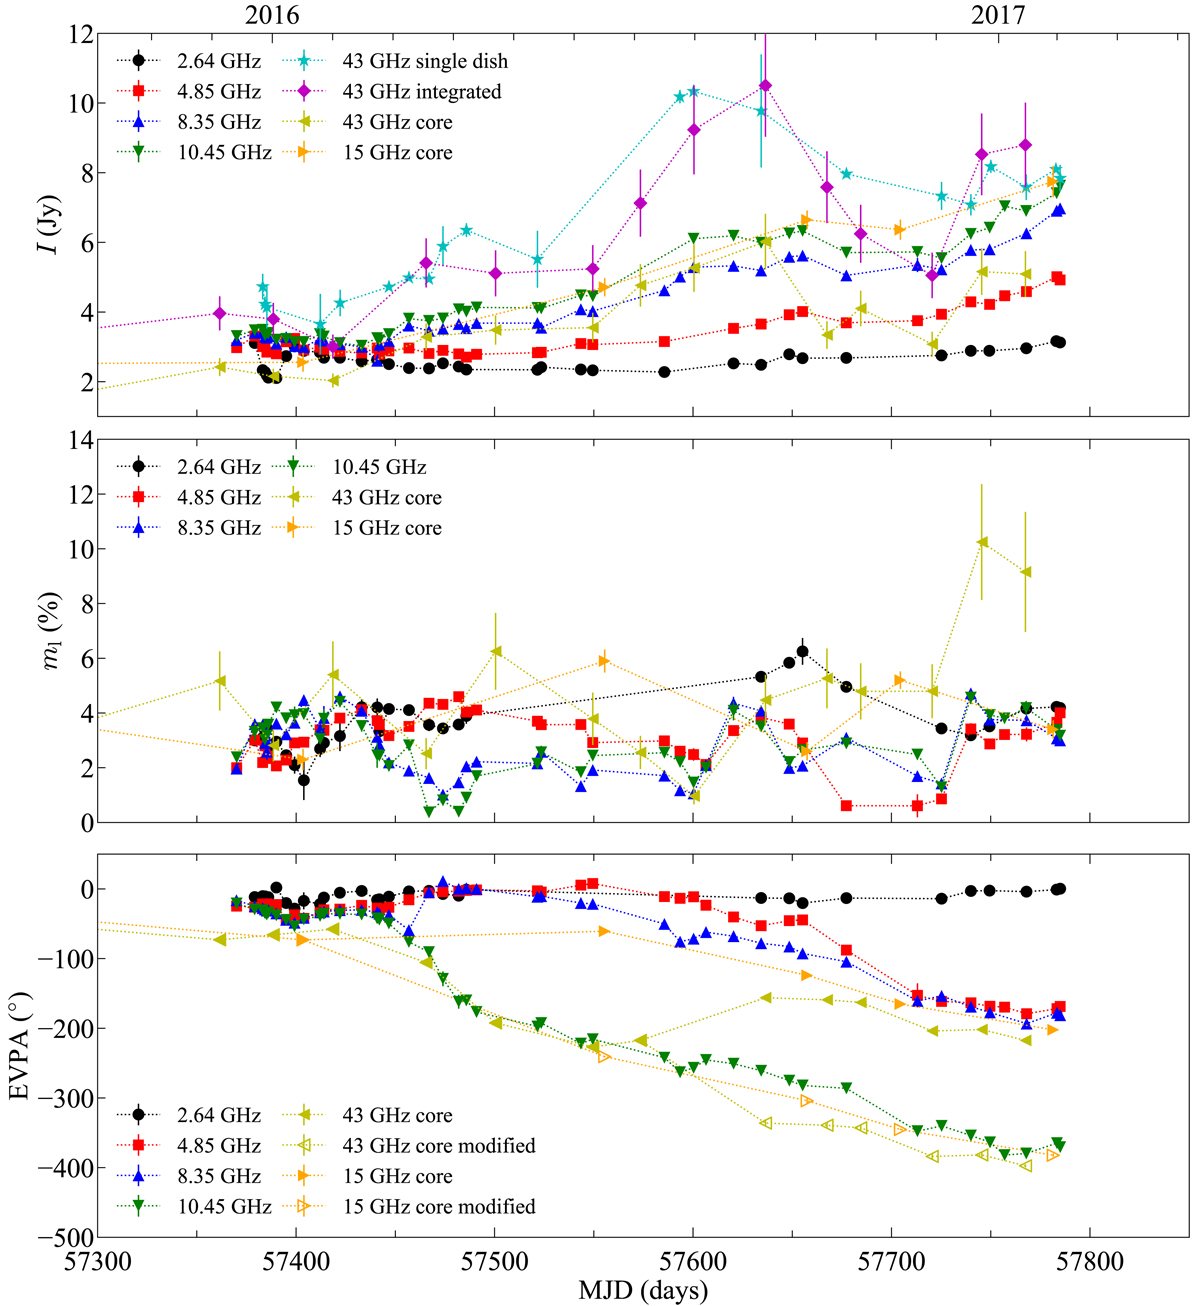
Comparison between the VLBI and single dish measurements of flux density and linear polarization. The Stokes I, m l and EVPA measurements are shown from top to bottom. The VLBI measurements are evaluated at the core of the jet. In the EVPA panel we plot both the original measurements as well as the modified values based on the justification in the text (see Sect. 4.1). In the first panel we also show the integrated Stokes I for the VLBI data sets at 43 GHz for a direct comparison with the single-dish measurements at the same frequency.
Current usage metrics show cumulative count of Article Views (full-text article views including HTML views, PDF and ePub downloads, according to the available data) and Abstracts Views on Vision4Press platform.
Data correspond to usage on the plateform after 2015. The current usage metrics is available 48-96 hours after online publication and is updated daily on week days.
Initial download of the metrics may take a while.