Fig. 7.
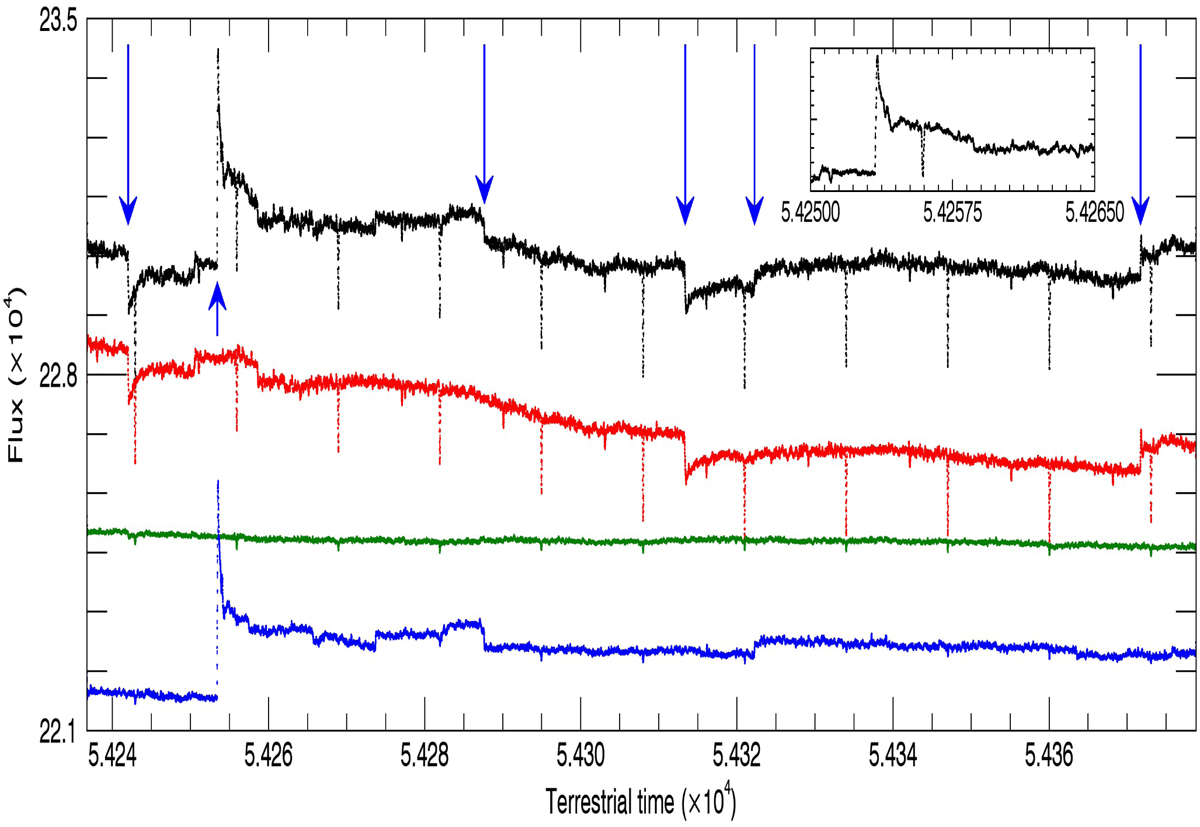
Light curves of an eclipsing binary that displays a series of discontinuities indicated by blue arrows. The colour code corresponds to the three colour light curves, with the resulting white light curve plotted in black. We note that the colour light curves have been shifted by a constant in order to avoid too large a scale on the y axis. The top inset is a magnification of a portion of the light curve where the discontinuity in flux is not a simple step but a sudden increase of the flux, followed by an exponential decrease as could be generated by the impact of a proton on the CCD.
Current usage metrics show cumulative count of Article Views (full-text article views including HTML views, PDF and ePub downloads, according to the available data) and Abstracts Views on Vision4Press platform.
Data correspond to usage on the plateform after 2015. The current usage metrics is available 48-96 hours after online publication and is updated daily on week days.
Initial download of the metrics may take a while.