Fig. 14.
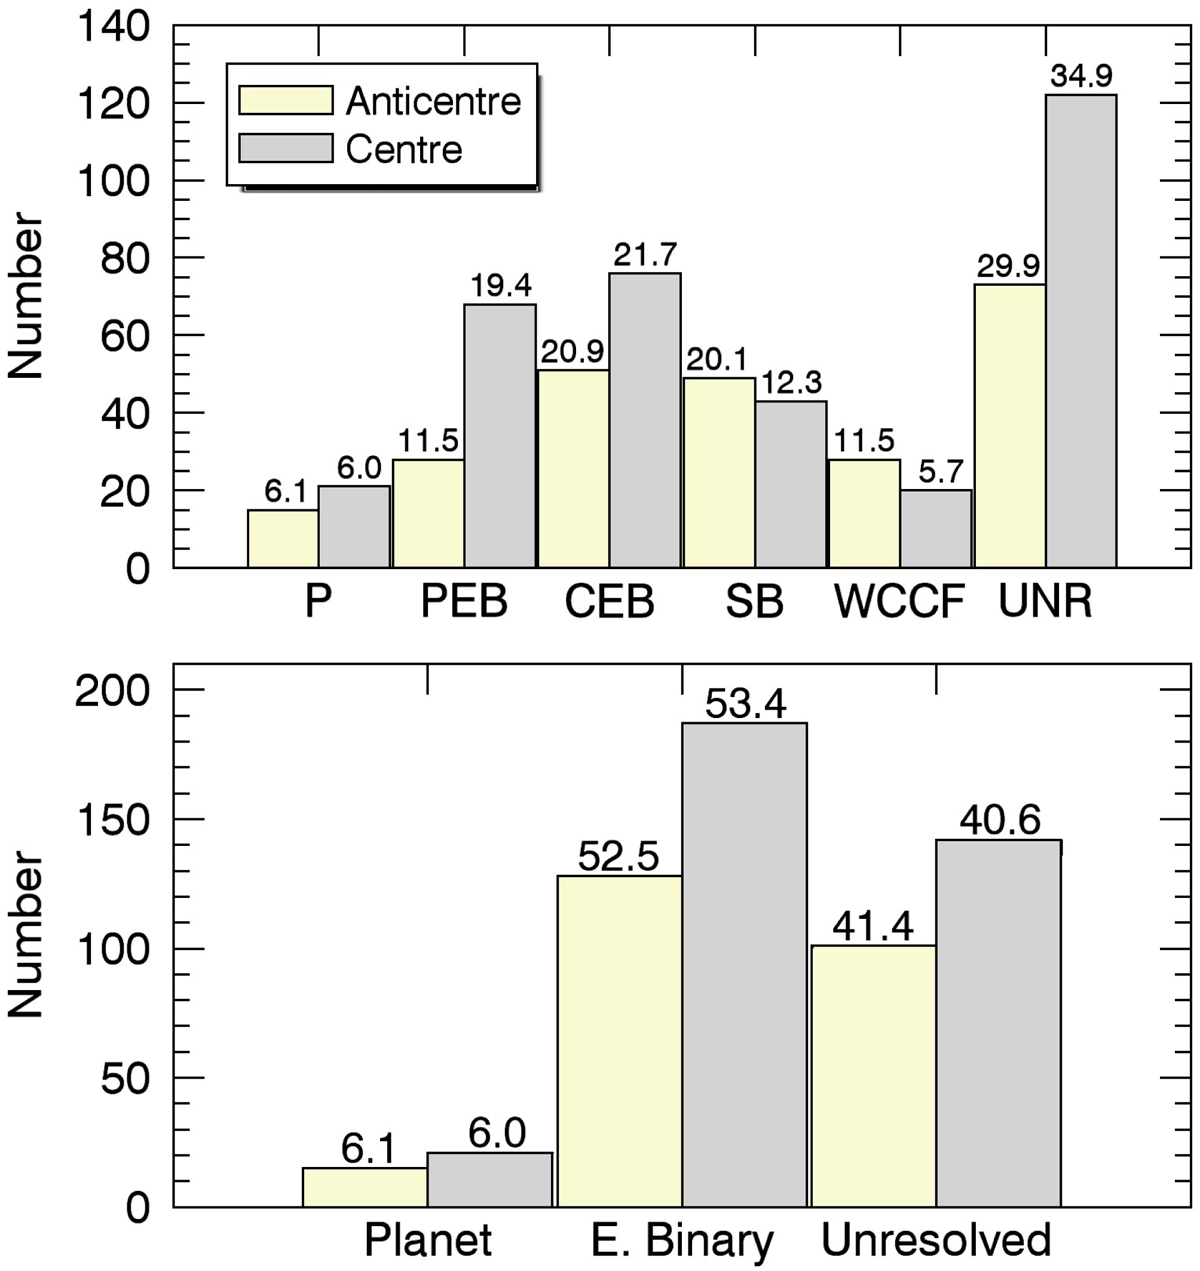
Distribution of the candidates among the six categories defined on the basis of the follow-up observations (top), and the three larger groups obtained by merging some categories together (bottom) in centre and anticentre (see text for details). The number at the top of each bin gives the percentage of the corresponding category in the considered direction.
Current usage metrics show cumulative count of Article Views (full-text article views including HTML views, PDF and ePub downloads, according to the available data) and Abstracts Views on Vision4Press platform.
Data correspond to usage on the plateform after 2015. The current usage metrics is available 48-96 hours after online publication and is updated daily on week days.
Initial download of the metrics may take a while.