Open Access
Fig. 13.
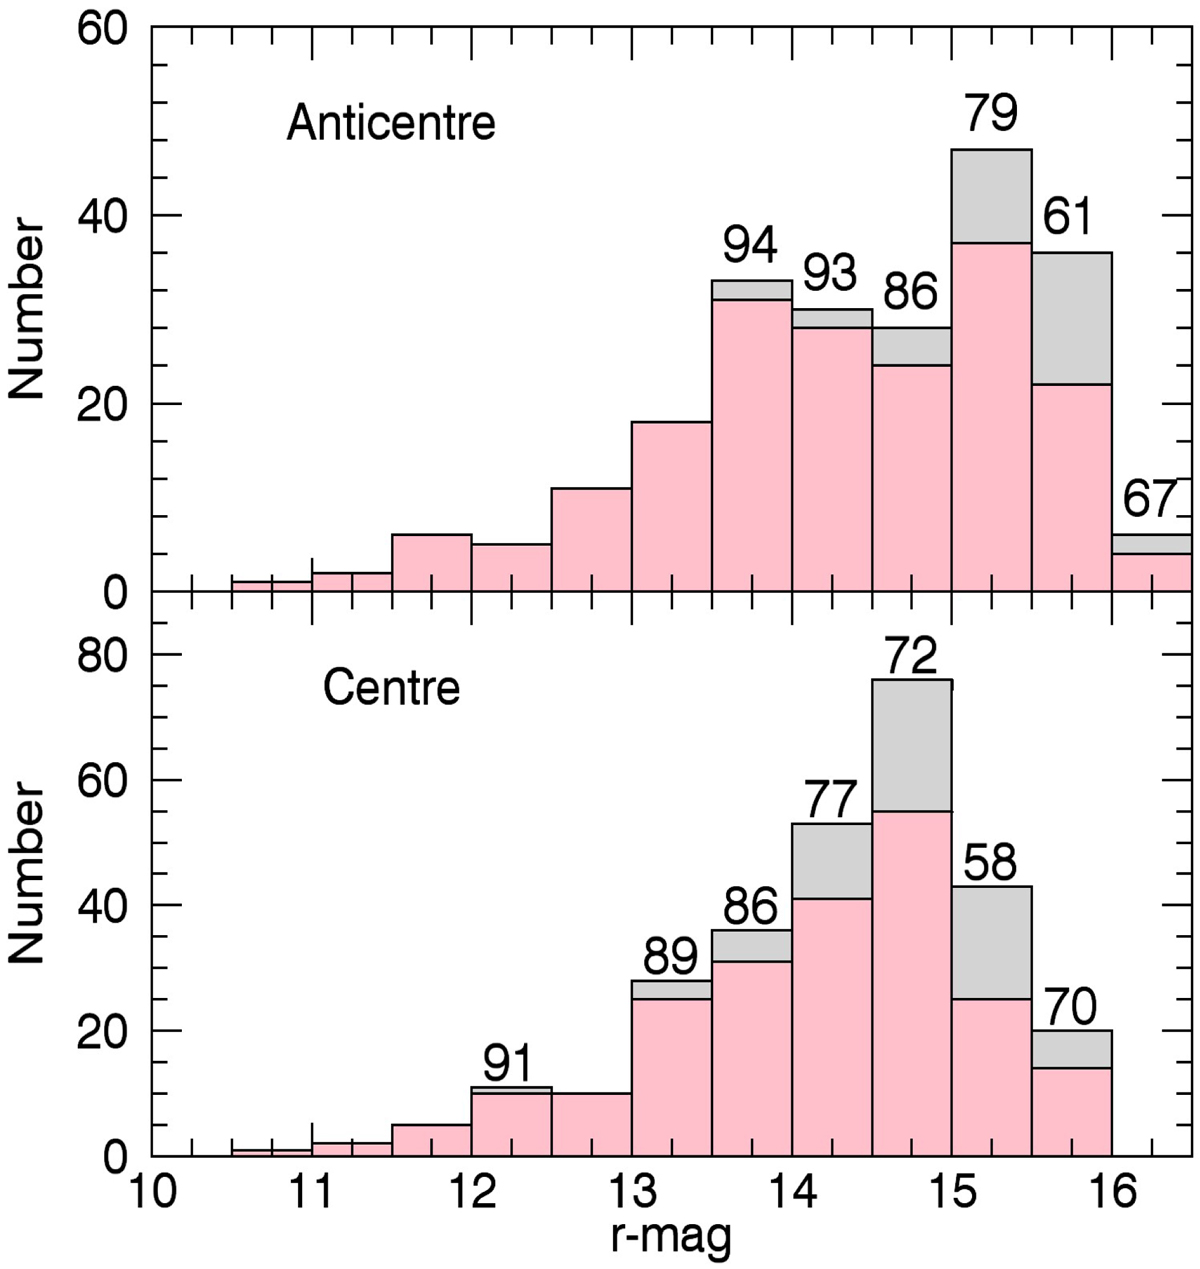
r-magnitude distribution of the full set of candidates (grey) and those that received follow-up observations (pink). The numbers at the top of each bin give the percentage of candidates observed from the ground in that bin when different from 100%.
Current usage metrics show cumulative count of Article Views (full-text article views including HTML views, PDF and ePub downloads, according to the available data) and Abstracts Views on Vision4Press platform.
Data correspond to usage on the plateform after 2015. The current usage metrics is available 48-96 hours after online publication and is updated daily on week days.
Initial download of the metrics may take a while.